

Twelve weeks of alerts. One ledger. Think of the model as a wind report for 45 harbors: it tells you where the wind is turning, not how to sail the boat. When several independent cycles converge on the same turning point, the Cycle Consensus Score crosses ±60, the critical zone: the cyclical tailwind under a market, or the headwind against it, has become strong enough to matter. Setting the sails, and deciding when to come home, is the sailor’s job. The model does not know what the Fed will say next, and it holds no opinion in the AI debate. It reads cycles.
Three months of daily articles flag the same market many times while a signal builds, so this review counts opportunities the way a reader experiences them: as episodes. An episode is one continuous stay on the alert list, one asset in one direction, from the day it first crosses into the critical zone until it drops off. Natural gas sitting on the bottoming list from April 24 through May 20 is one episode; its return on the topping side in late June is a second one. Each episode is then measured between its first alert and July 17: did price move in the signaled direction at all, how far did it run at its best close, and how quickly? No adjustments after the fact. What follows is the full record.
Summary
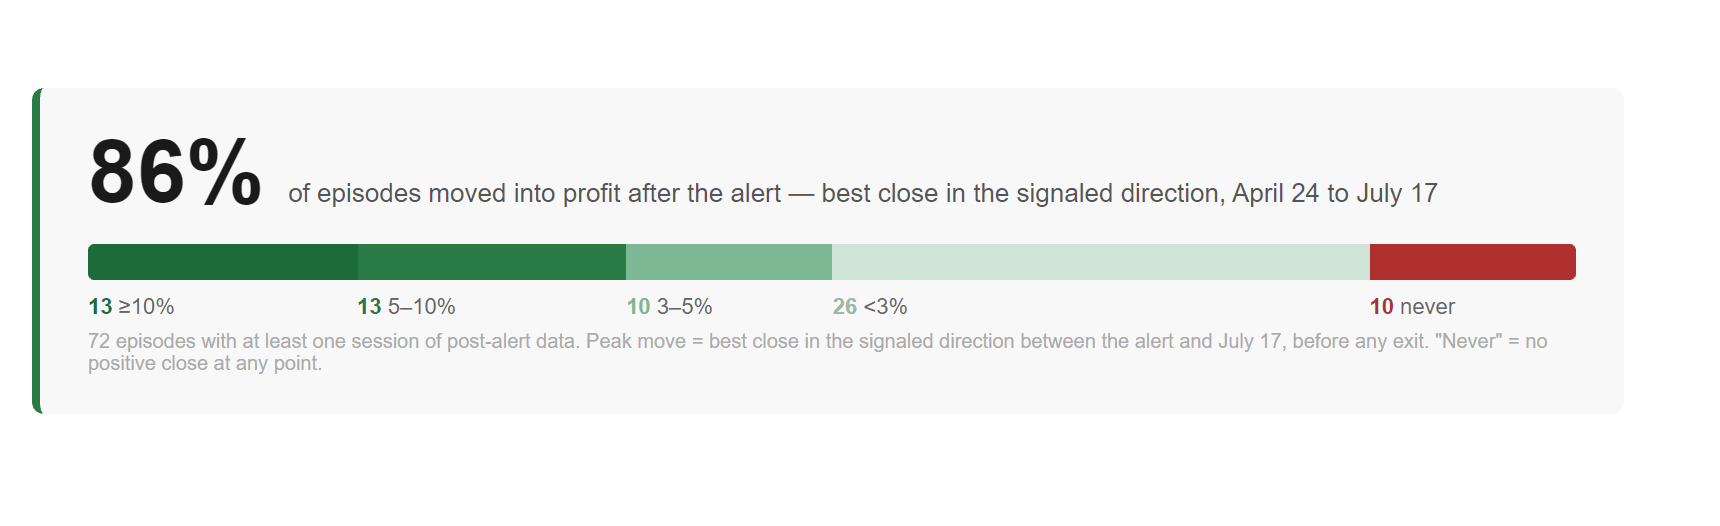
Start with what the model is built for. The Cycle Consensus Score is an alerting layer: it flags the markets where the cyclical conditions for a turn are present, early, across 45 instruments. It is not a complete trading system. It issues no exits and does not manage positions. Measured on its own terms, the quarter reads like this: 62 of the 72 episodes with post-alert data, 86%, moved into profit in the signaled direction at some point after the alert. Half reached at least 3% at their best close, 36% reached 5%, and nearly one in five ran into double digits. Only 10 episodes, 14%, never closed positive for a single session. The average episode offered a peak move of 5.3% (median 3.1%), and among the winners the peak arrived 23 days after the alert on average.
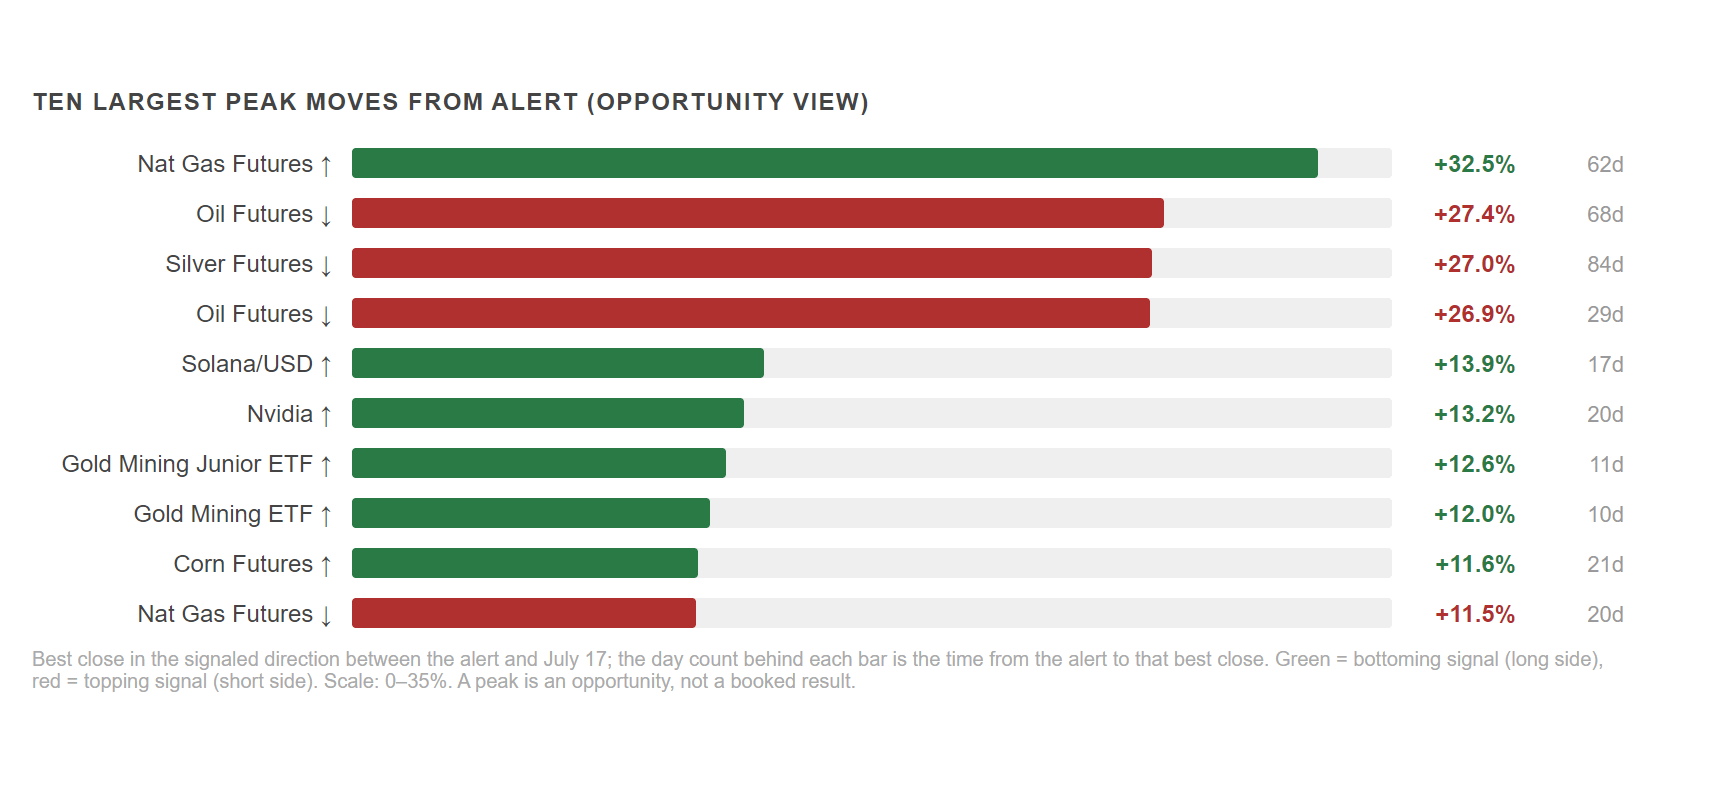
The top of the ledger shows what the lead time is worth. Natural gas offered 32.5% between the April 24 bottoming alert (article) and its June 25 peak. The April topping alert on crude (article) offered 27.4% to the July 1 low, and the June 2 re-entry offered 26.9% inside four weeks. The April silver topping alert (article) printed its best close on July 17, the final day of this review, 27% below the alert price, twelve weeks after the model first flagged the top. The May gold-miner longs (article) offered 12% within two weeks before the sector rolled over, which is the other face of the same number: the score opens the opportunity window and tells you when to be at the table. What you carry out of it depends on the exit, and the exit is yours.
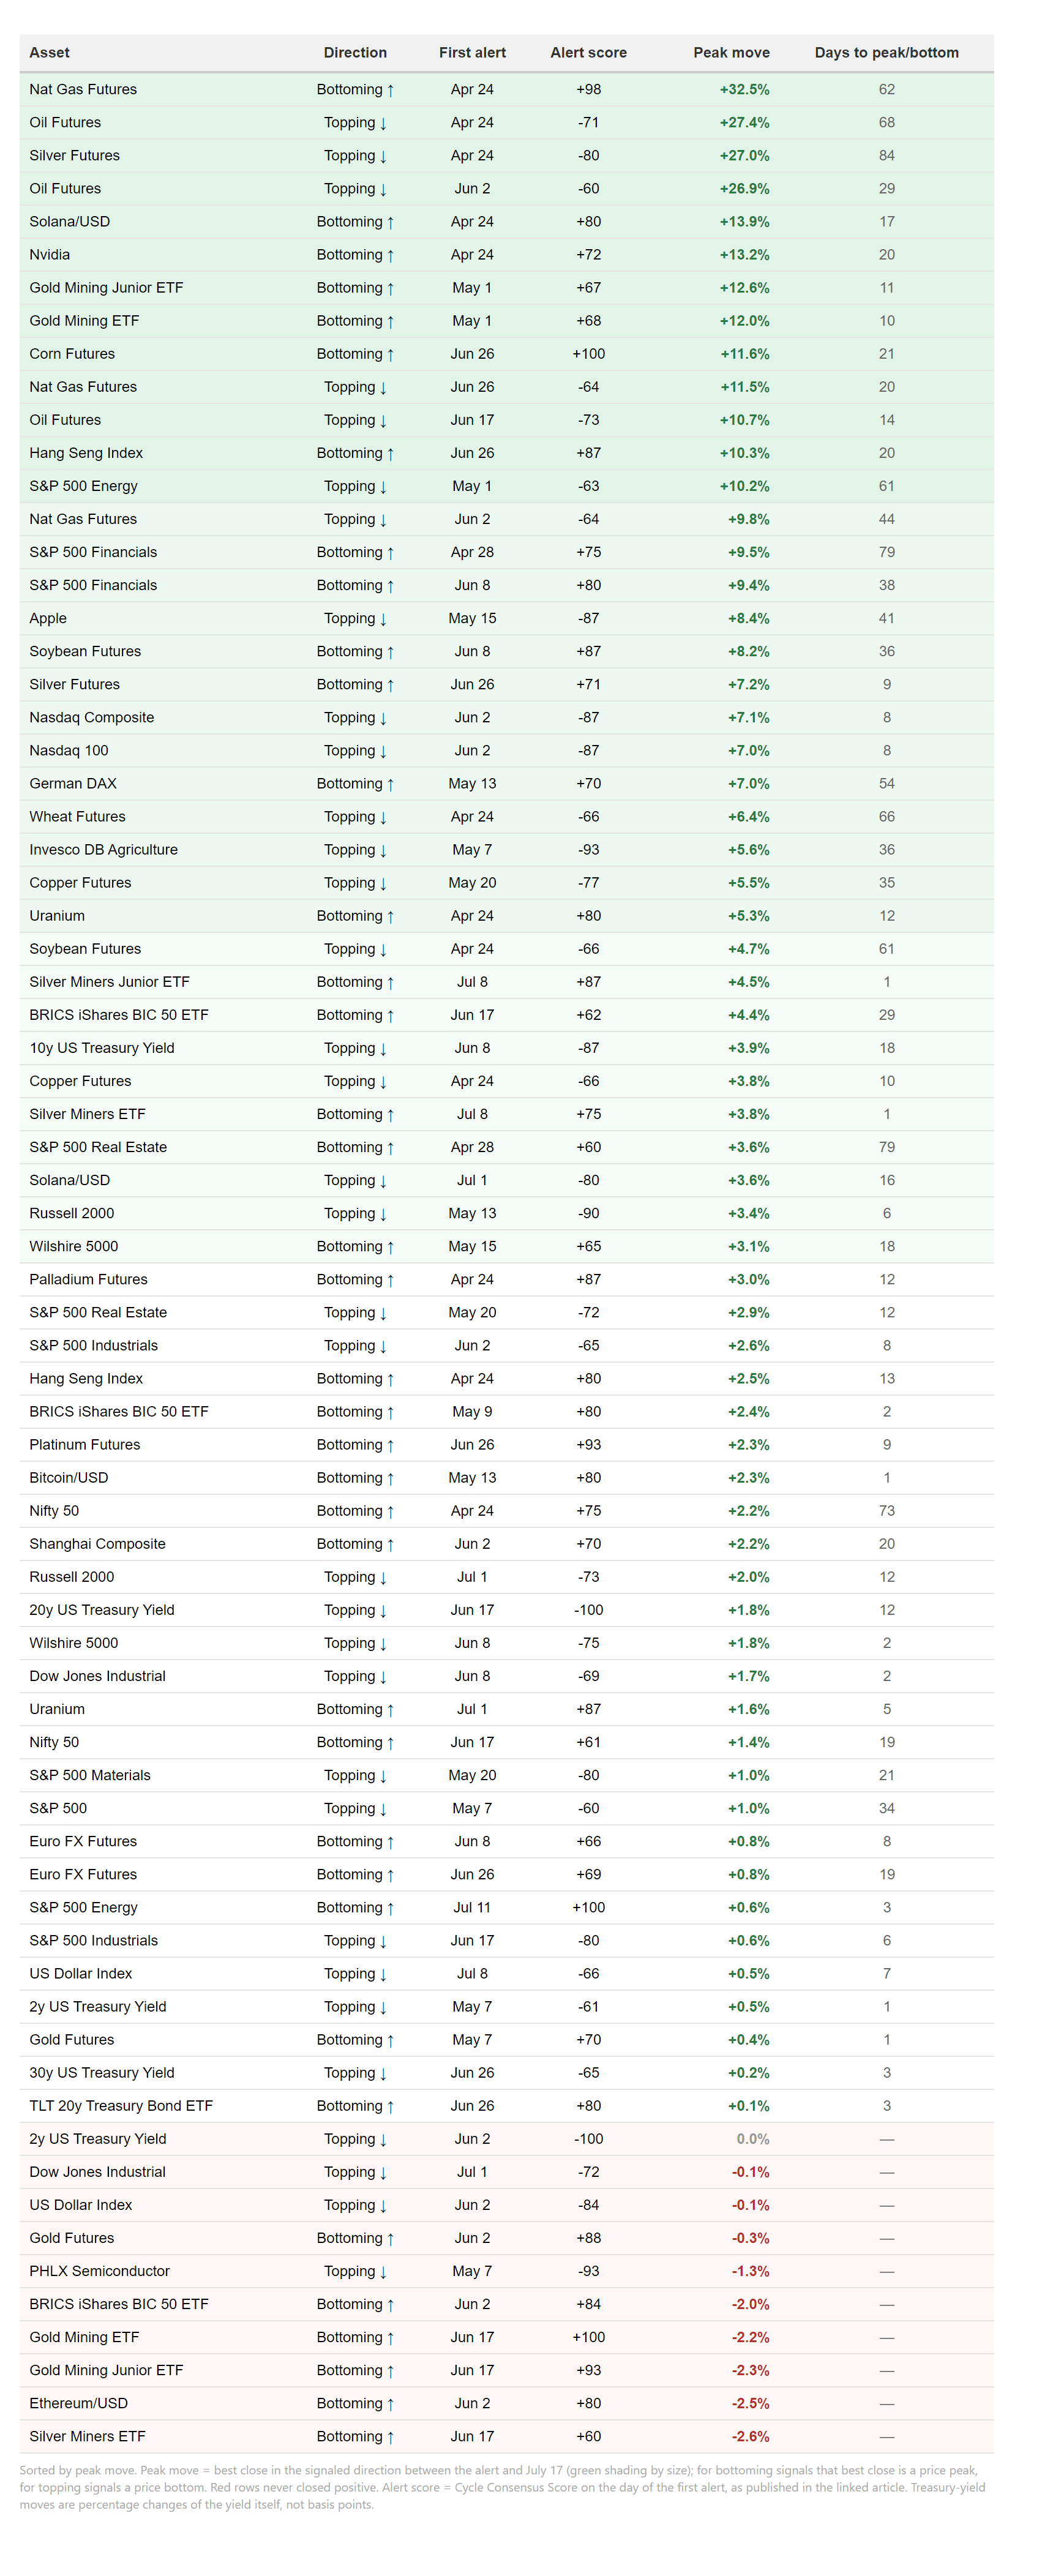
Eighteen daily articles cover the window from April 24 to July 17, 2026: 316 critical-zone signal rows, grouped into 77 distinct episodes, 72 of them with at least one session of post-alert data. The five newest entries from July 17 have no tape to score yet and roll into the next review. Everything else is in the scorecard, the chart, and the full episode table below.
The opportunity ledger
The chart shows the ten largest peak moves of the window, measured from the alert close to the best close in the signaled direction; the day count behind each bar is how long that move took to arrive. All ten crossed 10%. They split into two speeds: fast pops that peaked inside three weeks (the gold miners, Nvidia, Solana) and slow burns that needed two months and more (natural gas, crude, silver). Whether any of it survived to July 17 varied: the miners gave all of it back, gas and crude kept most.
Two markets in that chart deserve a closer look, natural gas first. It is on the list twice, in opposite directions: the April 24 bottoming alert (article) ran 32.5% to its June 25 peak, and the June 26 topping alert (article) caught the other side for 11.5% by mid-July. One market, one quarter, both turns flagged in advance. The two charts show each entry as it stood on the alert day: analysis cutoff at the alert, the light price section is what followed.
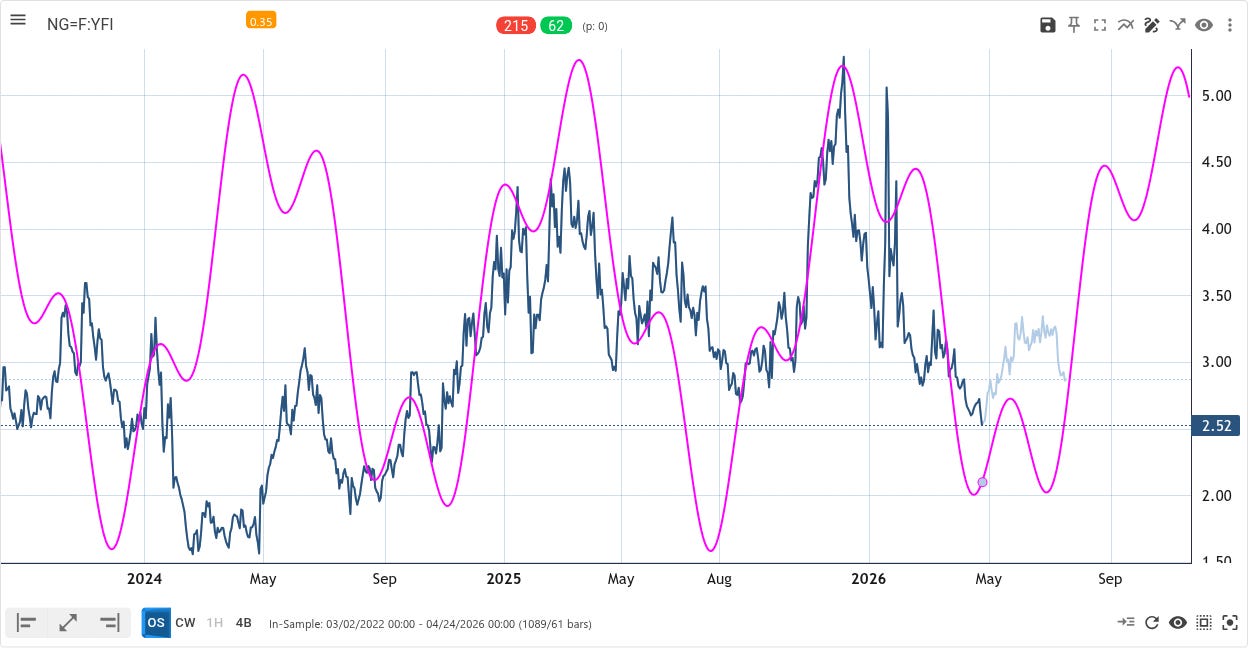
The long entry: natural gas, daily. The dominant-cycle composite (62- and 215-day cycles) bottoms at the April 24 analysis cutoff; the light price section is what followed. (Original alert)
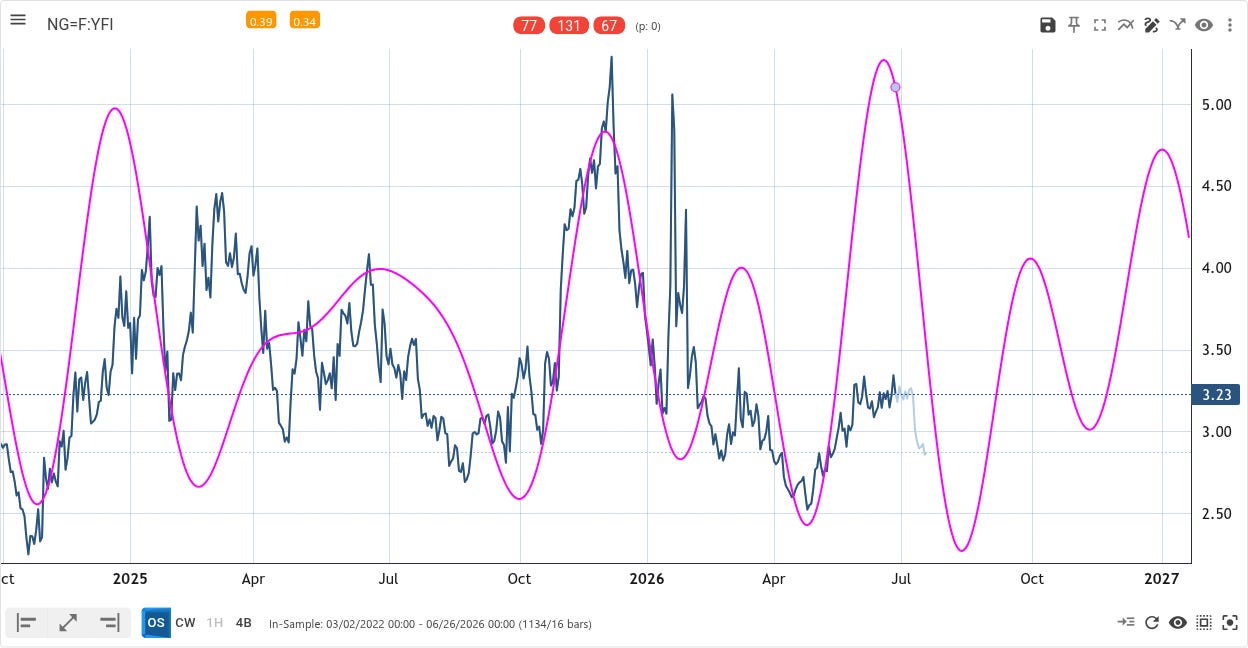
The short entry: the same market two months later. The composite (67-, 77- and 131-day cycles) tops at the June 26 analysis cutoff; the light price section is what followed. (Original alert)
Crude is on the chart twice as well: the April topping alert (article) needed ten weeks to reach its 27.4% peak, while the June 2 re-entry, a single quiet appearance at -60, delivered 26.9% inside four weeks, from $93.76 at the alert to $69.23 at the low.
How fast the peak arrives
Among the 62 episodes that moved into profit, the best close arrived 23 days after the alert on average. The distribution is the useful part: 23 peaked within ten days, 20 between day 11 and day 28, and 19 needed longer than four weeks. In practice, roughly a third of the opportunities are quick pops that demand a fast hand, a third mature inside the classic two-to-four-week turn window, and a third are slow burns that reward patience, silver’s twelve-week run being the extreme case.
What conviction added
The score’s extremes added less on this yardstick than expected. Episodes that reached the full ±100 delivered a 3% opportunity slightly more often than the rest, 56% against 48%, with an average peak of 6.1% against 5.0%. But three of the four largest opportunities of the quarter came from scores below the maximum, and the June 2 crude alert, the single best four-week move, entered the list with one appearance at exactly -60 and a neutral cRSI. On the opportunity ledger, breadth beats loudness: being at the table matters more than how hard the table was pounded.
The ten that never turned
Honesty requires the other end of the table. Ten episodes never closed positive for a single session: the June gold-complex bottoming calls (gold itself, both gold-miner ETFs, and the silver miners, all flagged June 17 (article) into a falling market), four topping calls that leaned against running trends (the semiconductor index, the Dow, the dollar, the 2-year yield), the June BRICS entry, and Ethereum. Most of them sit in the three trends that dominated the quarter: a US large-cap rally that would not break, rising yields, and falling precious metals. A high score is a necessary condition for most cyclical turns, not a sufficient one, and these ten are what that sentence looks like in practice. Several of the underlying signals are still live, gold’s seven-cycle floor at +93 (article) first among them; they belong to the next review.
The full episode table
Every episode, sorted by what it offered. Peak move is the best close in the signaled direction between the alert and July 17, a price peak for the long side and a price bottom for the short side; days to peak/bottom shows how long the opportunity took to develop; the last column links to the daily article that issued the alert.
The daily alert articles behind the table:
Apr 24 · Apr 28 · May 1 · May 7 · May 9 · May 13 · May 15 · May 20 · Jun 8 · Jun 17 · Jun 26 · Jul 11 · Jul 17
What this record says
The Cycle Consensus Score identifies a market condition, the point where enough independent cycles align that the cyclical tailwind under a market, or the headwind against it, becomes statistically meaningful. It is not a trading signal. None of the numbers above are returns anyone booked; they are the size of the window each alert opened. Turning a window into a result takes individual timing, position sizing, and an entry and exit plan, and those belong to the trader, not to the model.
What the record does show is an edge in knowing where to look. When the score crossed into the critical zone this quarter, six times out of seven the market moved in the signaled direction at some point afterward, half the time by 3% or more, in a quarter where three major trends refused to turn. That is the claim, the whole claim: when an asset enters the critical zone, it is time to take a closer look. This ledger is what that claim looks like when it is tested.
If you made it this far, thank you. A review like this one only has value if the ledger is complete, and this ledger is: every critical-zone alert from twelve weeks of daily scans, measured as opportunity against the tape, including the ten alerts that never went green. The daily newsletter is the front end of that ledger: each morning, a fresh scan across 45 global markets, and an alert the moment the Cycle Consensus Score crosses ±60. The alert is where the work starts. The exit is where it pays.
The gold episode, the yield complex, and five fresh July signals are already running. If you want to watch them resolve in real time instead of reading the verdict in October, subscribe below.
© 2026 Lars von Thienen, All Rights Reserved.
Information contained on this site is obtained from sources believed to be reliable, but its accuracy cannot be guaranteed. Lars von Thienen (”lars.cycles.org”) is a publisher of scientific cycle analysis results for global markets and is not a registered investment advisor. The published analysis is not designed to meet your personal circumstances. We are not financial advisors and do not give personalized financial advice. The opinions and statements contained herein are the sole opinion of the author and are subject to change without notice. They may become outdated and there is no obligation to update any such information.
Any projections, market outlooks, or estimates herein are forward-looking statements and are inherently unreliable. They are based upon certain assumptions and should not be construed to be indicative of the events that will occur. Past performance is not indicative of future results.
Investments should be made only after consulting with your financial advisor and only after reviewing the prospectus or financial statements of the company or companies in question. You should not make any decision based solely on what you read here.
Neither the publisher, the author, nor any of its affiliates accepts any liability whatsoever for any direct or consequential loss howsoever arising, directly or indirectly, from any use of the information contained herein.