

At the end of last year, we were expecting a prolonged upward trend because of the approximately 180-week cycle (~41 months), which was indicating positive momentum until late 2024.
Now, there's been a significant upward movement in the market. Price and technical targets have been achieved, signaling a warning that this upswing may be coming to an end.
Recap our analysis from March 2024
In March, I provided some pre-analysis on the cycles for NVIDIA and the S&P500 along with key indicators to monitor. You can review the public analysis to get started on this article.
The initial analysis of NVIDIA was conducted on March 18th, revealing that the downward cycle had commenced and technical indicators supported this conclusion. To gather a summary, please watch from minute 17:50 for approximately 5 minutes (just click on the image, the starting time is pre-set):
The second analysis focused on the US market using weekly data and screening of the S&P500 on March 4th. It concluded that the positive momentum in long-term cycle could end earlier than initially projected (Oct/Nov). For a brief recap, re-watch starting at minute 22:27 for about 5 minutes (just click on the image, the starting time is pre-set):
Lastly, both NVDIA and broader market through S&P500 displayed indications of an ending up-swing cycle.
As cycles often provide early insights into potential future trends, we have received valuable information about what to track. Consequently, let's now assess this situation with updated data as of early April.
Current Cycles Situation - April 2024
The long-term composite cycle model for the S&P500 signaled a top mid 2024. We now need to fine-tune the analysis. Here is the long-term composite model as guidance:

For those that are interested in the reference of the picked three cycles. These are exactly the same long-term cycles which for-warned us in October 2021 about the upcoming major top. You can read about our analysis back then here to re-confirm that we did not cherry pick these cycles.

As the long-term model suggests, mid-2024 is the projected next top to be expected. Looking at the cyclic tuned RSI, we are close to generating a long term signal now.
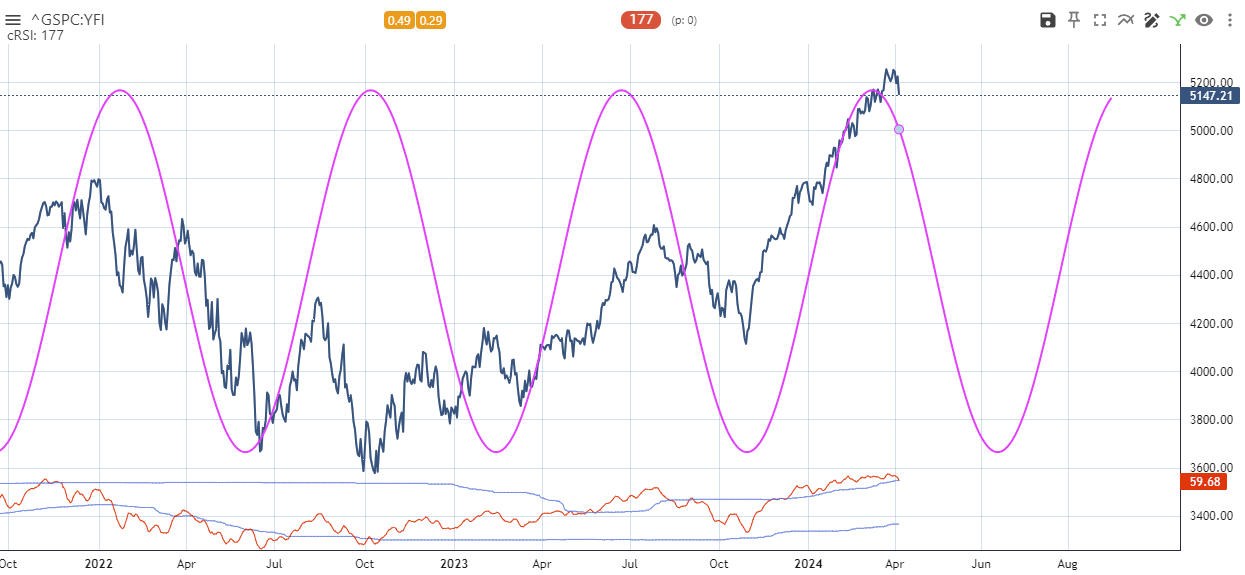
Now, lets zoom in on the shorter time-frames, the daily cycle analysis. Starting with the current short-term daily cycle with a length of ~177 days on the S&P500.
As the main US markets have mainly be driven by the AI-hype and the magnificent seven, lets have a closer look to NVIDIA weekly and daily cycles:


Now, using the identified weekly and daily cycles to fine-tune technical indicators on the price chart leads to the following view:
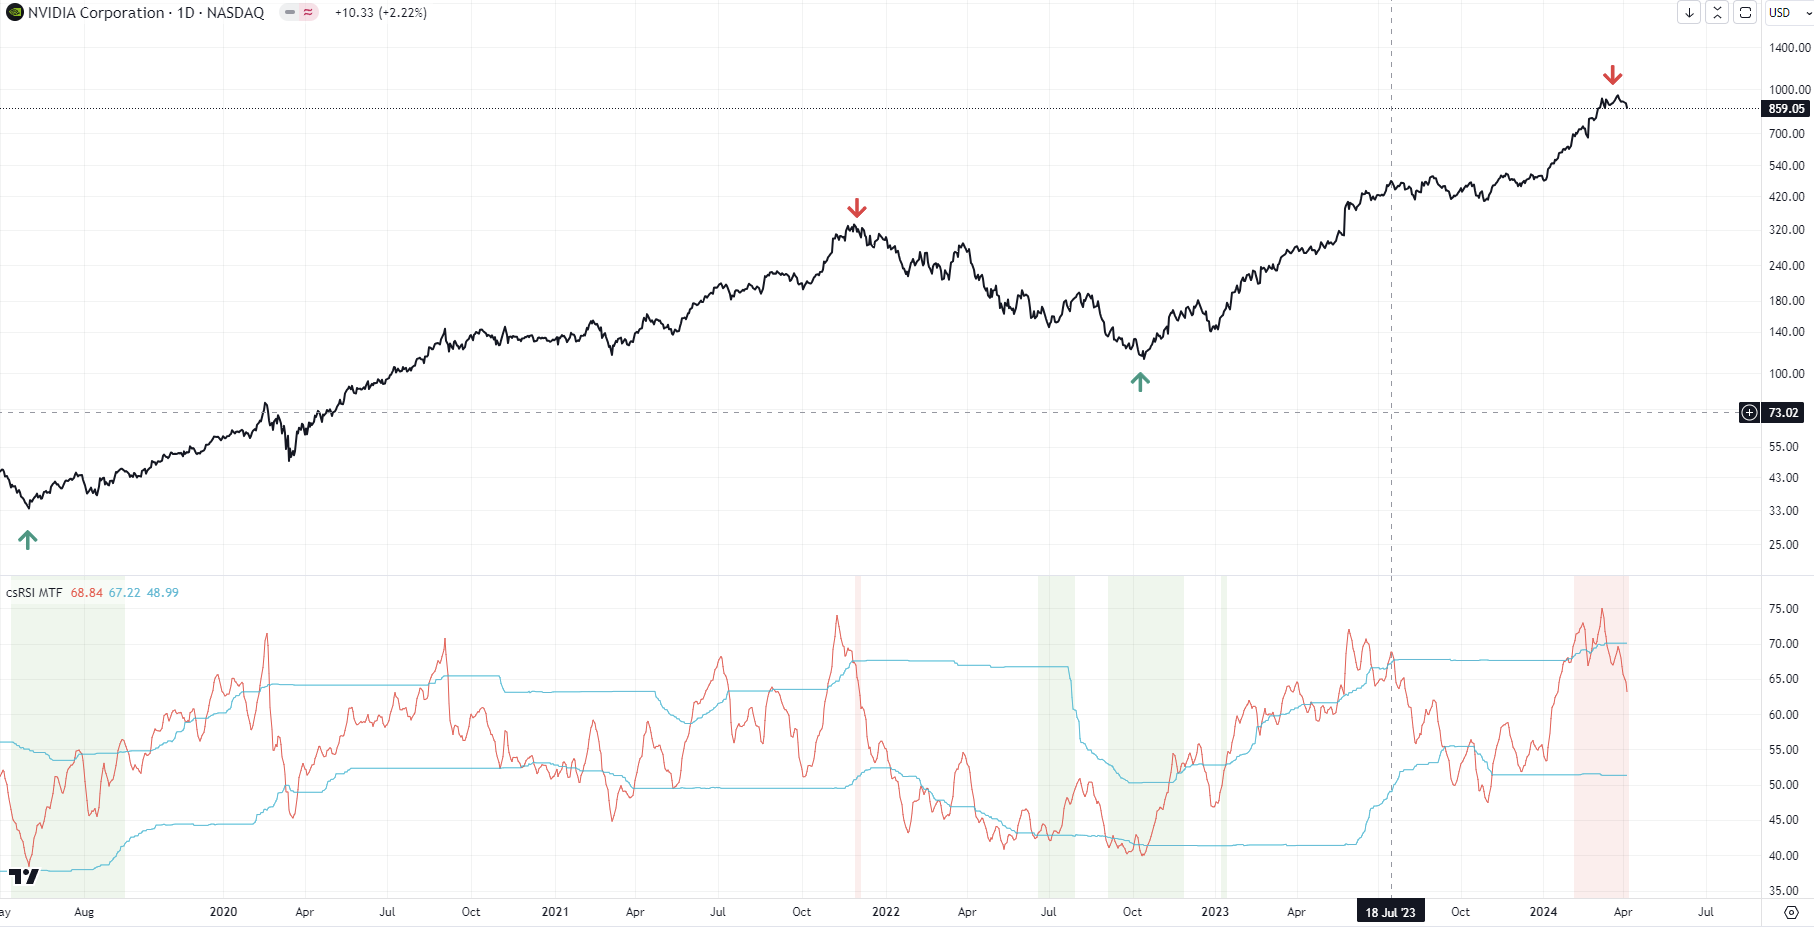
If you are new to this type of indicator, it reads the following:
The shaded areas indicate times from the longer timeframe. In this case when, based on the identified weekly cycle, the weekly RSI is overbought/oversold (red/green). In addition the signal lines and the bands show the technical condition for the daily cyclic tuned RSI. The best situations for sell signals occur, when the signal crosses below the upper band in times which are shaded in red. (And vice-versa for buy signals).
So the weekly, daily and technical cyclic tuned indicators speak a clear message about an ending of the upswing cycle now to be expected.
Lets add the broader US market S&P500 into the mix. Here is the short-term, daily cycles perspective:

And using the weekly and daily cycles to the technical condition. As indicated by the cyclic tuned RSI, the background turned “red” for the first time, while the signal is crossing below the upper band.

For sure, these upswing momentum phases can last a very long time. We observed a similar timing situation during summer 2021. You can see from the cycles model and the technical signals during summer 2021, that it took also from May to November to turn the market.
But for now, we have this first signals in the book that this cyclic upswing is coming to an end.
Disclaimer
Information contained on this site is obtained from sources believed to be reliable, but its accuracy cannot be guaranteed. Lars von Thienen “lars.cycles.org” is a publisher of scientific cycle analysis results for global markets and is not an investment advisor. The published analysis is not designed to meet your personal circumstances – we are not financial advisors and do not give personalized financial advice. The opinions and statements contained herein are the sole opinion of the author and are subject to change without notice. It may become outdated and there is no obligation to update any such information.
Any projections, market outlooks or estimates herein are forward looking statements and are inherently unreliable. They are based upon certain assumptions and should not be construed to be indicative of the events that will occur.
Investments should be made only after consulting with your financial advisor and only after reviewing the prospectus or financial statements of the company or companies in question. You shouldn’t make any decision based solely on what you read here.
Neither the publisher, the author nor any of its affiliates accepts any liability whatsoever for any direct or consequential loss howsoever arising, directly or indirectly, from any use of the information contained herein.
Bonus: Hurst FLD price target analysis
This section provides additional context using time-cycles to derive possible price targets where up-/down moves might come to an end within the current cyclic up- or down move. This cyclic-price target model uses Hurst concept of “FLD” to (a) identify if a cycle is in force and (b) derive the price target where this move will end.
This bonus analysis allows us to show us what to look out for in the period of April to May in regards to when the upswing cycle will come to an end.


