

Financial stress index analyzed for cyclic patterns, indicating potential market trends. Harmonic relations of cycles offer deeper insights for better forecasting.
Financial stress index points to a major market top by year-end, aligning with other long-term cycle models.
Content
Identifying dominant cycles in financial stress index crucial for market trend predictions.
Adding harmonic relations of cycles refines forecasts for more precise timing of market movements.
Intro
This episode reviews the Financial Stress Index published by the Fed of St. Louis. It can be used as a “sentiment” index to measure sentiment extremes. These sentiment extremes correlate to vice-versa to changes in trend in the US stock market. However, the raw data alone is not of any help to detect turning points in regards to “timing the market”. But we can apply cycle analysis to get a sense about existing cycles in the financial stress dataset. If cycles can be identified, this will help us to project the next possible extreme for financial stress, and, in addition, project possible upcoming major turns in the stock market.
At the end of the episode, I will provide the full interactive chart and the cycles workbook for further analysis for my subscribers.
The chart below shows the identified dominant cycle in the Financial Stress Index with a length of 186 weeks.
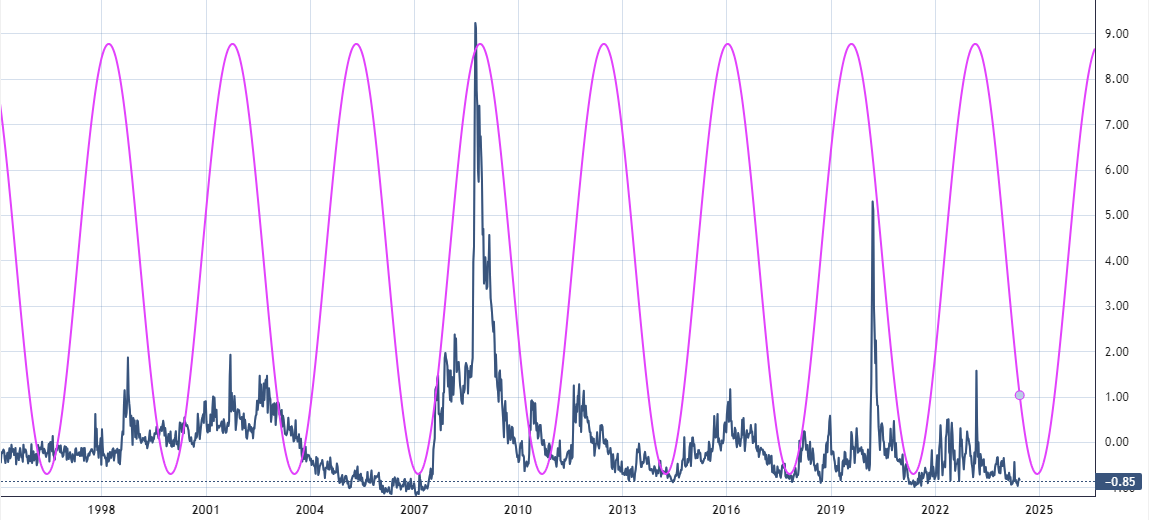
The cycle indicates that we are heading into a “financial stress cycle bottom”. In turn, would indicate a major market top. Projected for around end of 2024.
In this article, I would also like to put attention to the concept of harmonics, or cycle harmonics. Often, cycles dont come as singular cycle. A dominant cycle comes with its childs. The child cycles always have a harmonic relation to the parent cycle. The cycle Harmonic Chart below highlights harmonic correlations between the 186w parent cycle and two shorter sub-cycles with the length of 59 and 66 weeks.
Cycle Harmonics

Now, lets plot these financial stress cycles on top of an US stock market chart. I will use the Wilshire 5000 as this is a very broad index. During these times when the S&P500 is skewed by the Mag7, it is better to use broader indices for our general market analysis.
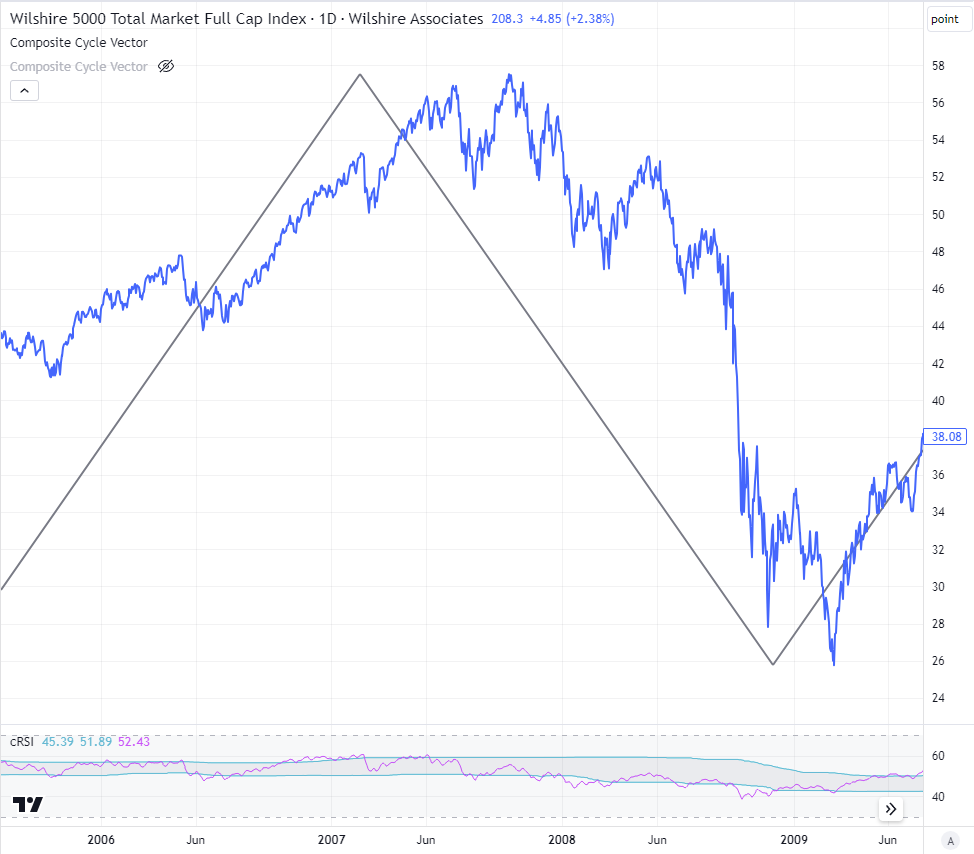
Below, the Wilshire 5000 is plotted in blue, and the 186w cycle is overlayed as zigzag plot. You can see that there is a good fit timing the market top before the crash in 2007 and timing the expected bottom afterwards.
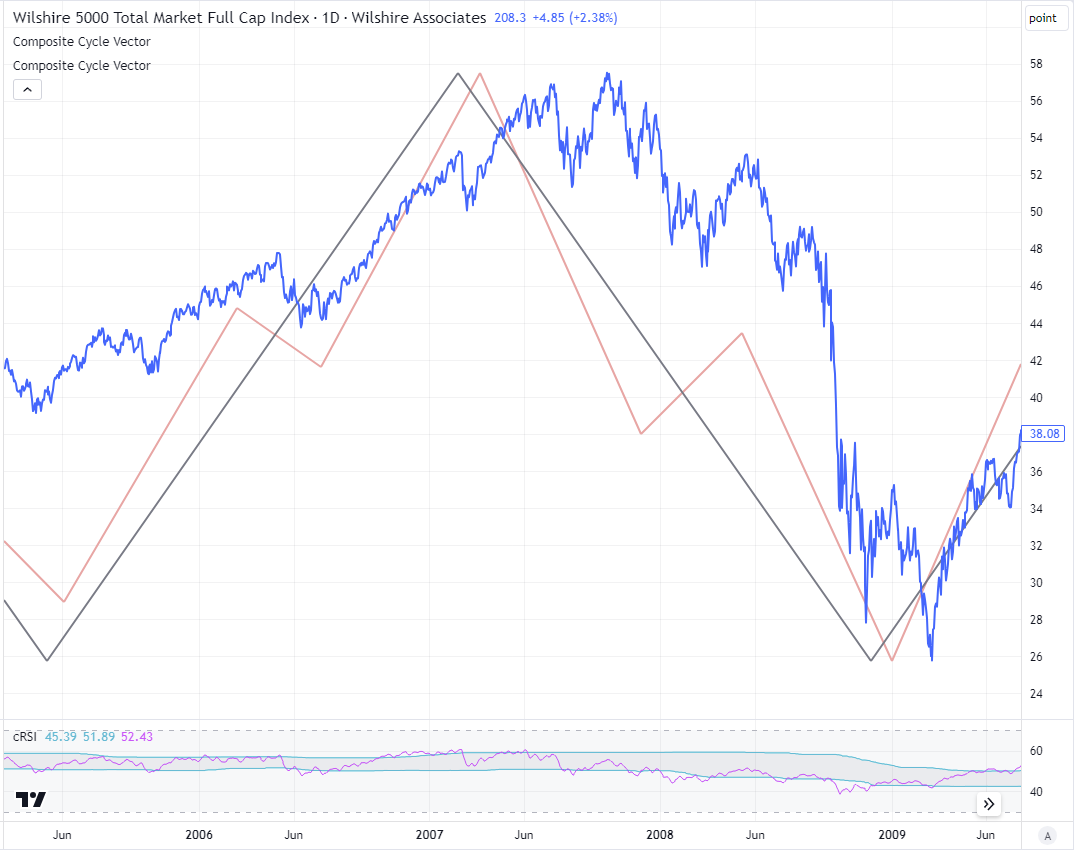
However, now adding the harmonic sub-cycles of 59 and 66 weeks into the mix, creating a composite cycle model consisting of 3 cycles (186, 66, 59), the cycles model looks like shown in the next chart.
This cycle was able to time the sub-mechanics of the Jun/Jul bottom 2006 and the interim low/top at the beginning of 2008. While keeping the main timing.

So once an dominant cycle is identified, adding the harmonic related cycles really improves the timing projection capabilities. The next chart shows both cycles overlayed. The simple 1-cycle dominant model and the 3-cycle model for comparision.
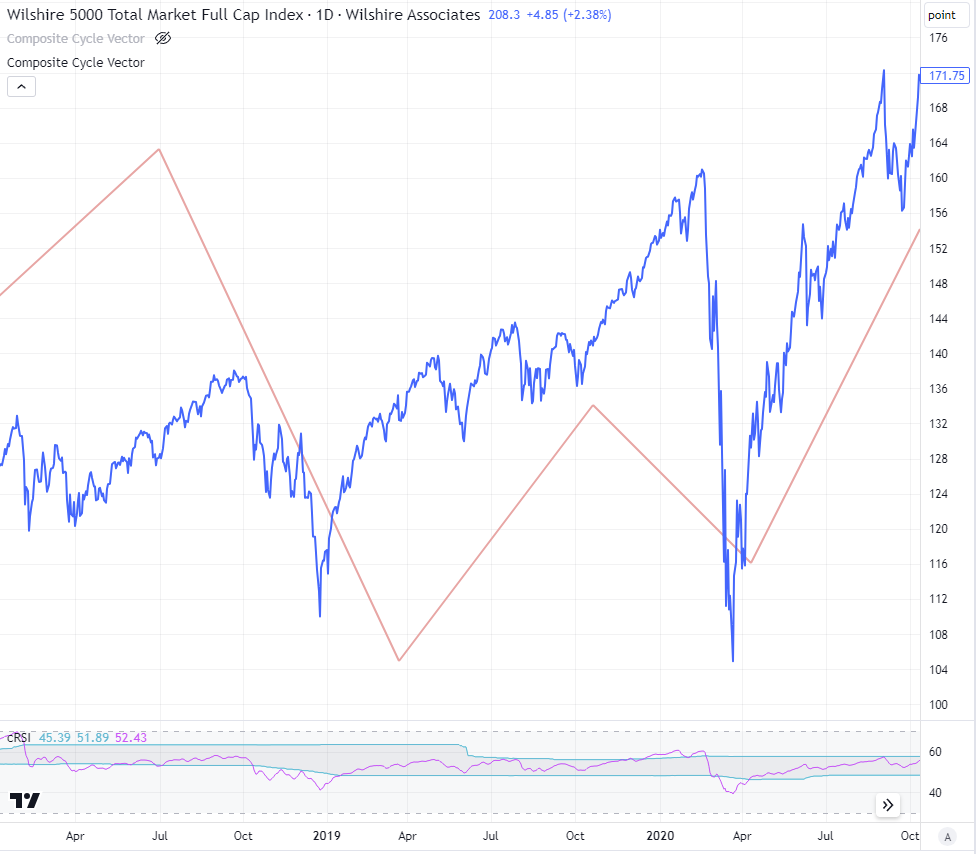
Lets use another example. The next situation shows the financial stress top (plotted vice-versa) around July 2019. You can see that we had a double bottom on the US stock market with one bottom earlier around Dec. 2018 and another bottom March 2020. The dominant cycle was perfect in showing the “middle” of the expected bottom if you zoom-out with a larger view. But it would be better if we would have been able to time this double bottom.
Single Dominant Cycle View

Therefore, lets again add the 2 sub-cycles and check the composite cycle plot again. Now, what a beauty, adding the 2 sub-cycles and create the 3-cycle composite, the double bottom is almost perfectly seen by this composite model.
Key cycle with 2-harmonic sub-cycles
Key Insights
- Understanding dominant cycles in data sets like the financial stress index aids in predicting market behavior accurately.
- Incorporating harmonic relations of cycles enhances forecasting by providing more nuanced insights into market timing.
- Financial stress index predicts a significant market peak at the end of the year, signaling potential market shifts.
- Utilizing alternative data sets for cycle analysis can offer unique perspectives and better forecasting capabilities.
- Harmonic relations of cycles fine-tune short-term market movements for improved forecasting accuracy.
Charts and cycle workbooks included at the bottom
👇 👇 👇
© 2024 Lars von Thienen, All Rights Reserved.
Information contained on this site is obtained from sources believed to be reliable, but its accuracy cannot be guaranteed. Lars von Thienen “lars.cycles.org” is a publisher of scientific cycle analysis results for global markets and is not an investment advisor. The published analysis is not designed to meet your personal circumstances – we are not financial advisors and do not give personalized financial advice. The opinions and statements contained herein are the sole opinion of the author and are subject to change without notice. It may become outdated and there is no obligation to update any such information.
Any projections, market outlooks or estimates herein are forward looking statements and are inherently unreliable. They are based upon certain assumptions and should not be construed to be indicative of the events that will occur.
Investments should be made only after consulting with your financial advisor and only after reviewing the prospectus or financial statements of the company or companies in question. You shouldn’t make any decision based solely on what you read here.
Neither the publisher, the author nor any of its affiliates accepts any liability whatsoever for any direct or consequential loss howsoever arising, directly or indirectly, from any use of the information contained herein.


