
Real Estate Cycle Analysis: Housing Permits, Prices & Employment Trends
Explore how cycle analysis reveals real estate trends using housing permits, home prices, and employment data to forecast sector shifts and economic outlooks.

Real Estate Cycle Analysis

The real estate market is a major part of the economy, contributing around 14% to the US GDP. Understanding its cycles can provide valuable insights into economic shifts and investment opportunities. In this article of my “GDP Cycle Series”, we’ll break down how cycle analysis works in the real estate sector by focusing on three key data points: housing permits, home price momentum, and employment trends. This approach offers a data-driven perspective on real estate cycles rather than relying on headlines or news sentiment.
The previous reports in this GDP cycle series can be found here:


Why Focus on Real Estate Cycles?
Real estate, finance, insurance, rental, and leasing sectors together make up about 20% of the GDP, with real estate alone accounting for 14%. This sizable share means fluctuations here can impact the broader economy. Analyzing cycles in this sector helps us understand possible turning points, expansions, or contractions that might ripple through the economy.
Before jumping into analysis, it’s critical to choose the right data. Quarterly data often lacks the granularity needed for detailed cycle analysis, so monthly or weekly data series are preferred. Reliable sources like the Federal Reserve Bank of St. Louis (FRED) provide free access to relevant data sets, including housing permits, home price indices, and employment figures.
Key Data Sets for Real Estate Cycle Analysis
1. Housing Units Authorized (Housing Permits)
This data tracks the number of new privately-owned housing units authorized for construction, serving as an early indicator of supply and demand in the market. Rising permits generally signal confidence and potential growth, while declines hint at contraction.
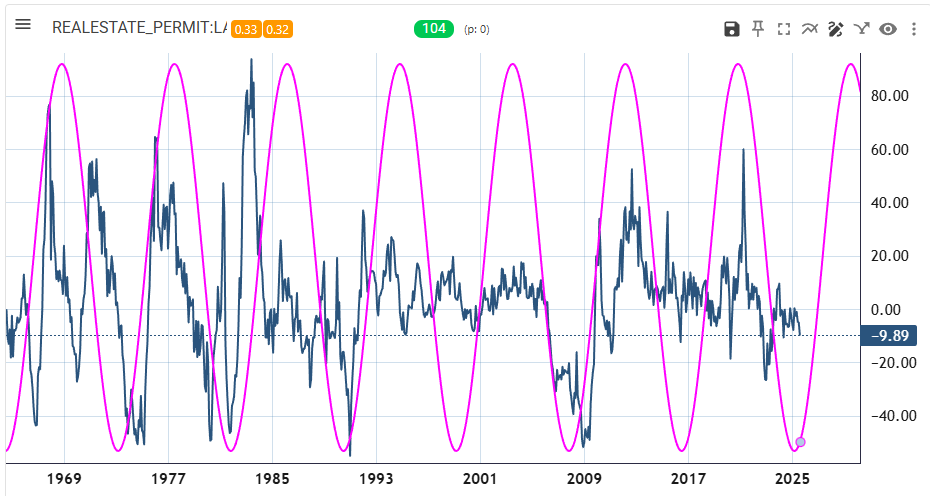
Raw Data vs. Rate of Change
While raw permit numbers are useful, analyzing the year-over-year percent change reveals trends and cycles more clearly.Cycle Insights
Cycle analysis identifies dominant cycles around 85 to 104 months (7 to 8.5 years) in the permits data, which have remained stable over decades. These cycles help predict potential bottoming or peaks in housing supply activity.
2. S&P Case-Shiller US Home Price Index
This index tracks home price changes nationwide, reflecting consumer confidence and market momentum in real estate prices.
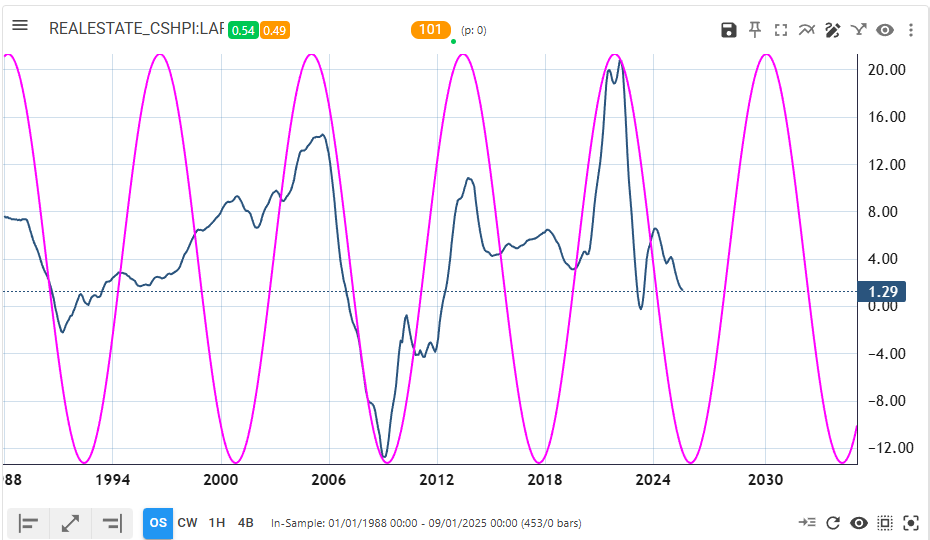
Why Use Rate of Change?
Since home prices generally rise over time due to inflation and asset appreciation, analyzing the percent change year-over-year removes long-term trends and highlights cycles.Cycle Findings
A strong and stable cycle of approximately 100 months emerges in the home price momentum data, showing periods of price acceleration and deceleration. Recent data suggests prices may be stabilizing after a slowdown, with potential for renewed upward momentum around 2026.
3. Employment in Real Estate, Rental, and Leasing
Employment figures indicate the health of the sector from a workforce perspective, showing expansions or contractions in jobs.
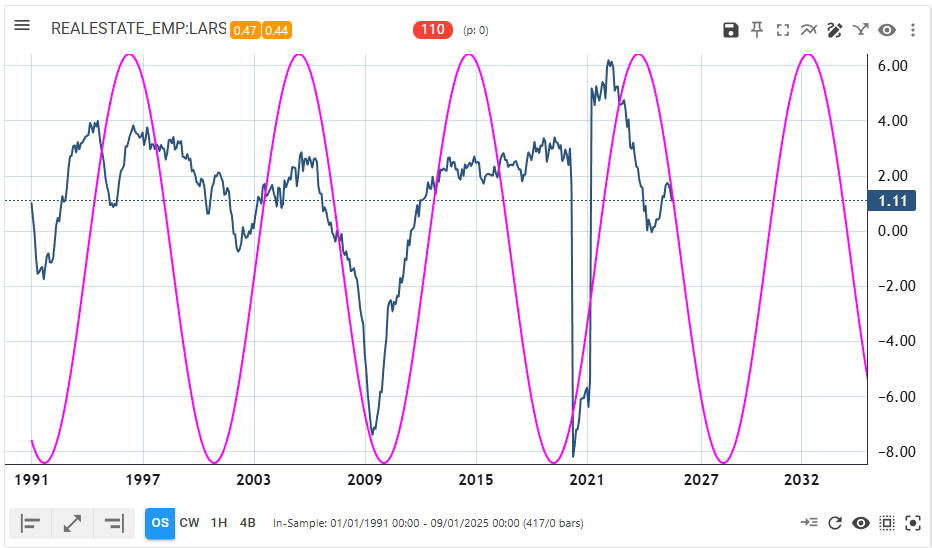
Data Treatment
Similar to other data sets, the focus is on the percent change in employment year-over-year to remove long-term growth trends and isolate cyclical patterns.
Cycle Characteristics
Employment momentum displays a roughly 110-month cycle, highly stable over time. Current analysis points to a downswing continuing until approximately 2027-2028, implying potential job losses in the sector in coming years.
How Cycle Analysis Works in Real Estate
Understanding Cycles and Stability
Cycle analysis involves detecting repetitive rhythms or cycles in time series data. The process includes:
Loading monthly data series into a cycle scanner tool.
Identifying dominant cycles by analyzing the data’s spectrum and amplitude peaks.
Assessing cycle stability, which measures how consistent the cycle’s phase and amplitude have been over time (stability scores above 0.5 are considered reliable).
Using these stable cycles to forecast potential future turning points, such as bottoms or peaks.
Interpreting Cycle Lengths
The cycles detected in the real estate sector tend to be long-term, spanning around 7 to 9 years (85 to 110 months). These long cycles align well with known real estate market rhythms, which often reflect broader economic expansions and contractions.
What Do These Cycles Tell Us About the Current Market?
Mixed Signals from Different Data Points
Housing Permits: Indicate a potential bottom forming with expected increases in new construction demand in the coming years.
Home Prices: Show signs of stabilizing after a slowdown, with momentum possibly turning positive.
Employment: Suggests a continuing contraction with possible job losses in the sector over the next two to three years.
Reconciling Contradictions
These diverging signals reveal the complexity of the real estate market. While demand for new homes might rise, technological changes, automation, or shifts in construction methods could reduce the need for labor, explaining the employment downturn despite rising permits.
Practical Applications of Real Estate Cycle Analysis
For Investors
Cycle analysis helps identify when the market is likely to bottom or peak, aiding timing decisions for buying or selling properties or REITs.
For Policymakers
Understanding these cycles can guide policy interventions to support housing supply or employment in downturns.
For Homebuyers and Builders
Insight into permit trends and price momentum can inform decisions on when to build or purchase homes.
Final Thoughts
Cycle analysis provides a powerful lens to understand the rhythmic nature of the real estate market beyond headline news or short-term speculation. By combining housing permits, price momentum, and employment trends, analysts gain a multi-faceted view of where the sector stands and where it might be headed.
The current cycles suggest we are near a bottoming phase for housing permits and prices, while employment may take longer to recover. This nuanced outlook underscores the importance of looking at multiple indicators when assessing real estate market health.
Thanks for reading! If you enjoyed this deep dive into real estate cycle analysis or want cycle insights into other economic sectors, share the article with your friends and colleagues!
Regards,
Lars
Hamburg, Germany 02. December 2025
The video breakdown is also available:
© 2025 Lars von Thienen, All Rights Reserved.
Information contained on this site is obtained from sources believed to be reliable, but its accuracy cannot be guaranteed. Lars von Thienen “lars.cycles.org” is a publisher of scientific cycle analysis results for global markets and is not an investment advisor. The published analysis is not designed to meet your personal circumstances – we are not financial advisors and do not give personalized financial advice. The opinions and statements contained herein are the sole opinion of the author and are subject to change without notice. It may become outdated and there is no obligation to update any such information.
Any projections, market outlooks or estimates herein are forward looking statements and are inherently unreliable. They are based upon certain assumptions and should not be construed to be indicative of the events that will occur.
Investments should be made only after consulting with your financial advisor and only after reviewing the prospectus or financial statements of the company or companies in question. You shouldn’t make any decision based solely on what you read here.
Neither the publisher, the author nor any of its affiliates accepts any liability whatsoever for any direct or consequential loss howsoever arising, directly or indirectly, from any use of the information contained herein.