
Main Street turned off the lights - Wall Street continues dancing in the dark
Stop Watching the S&P 500: Why the Real Economy is Built on Bricks and Assembly Lines, Not Wall Street Algorithms


You hear it every day: “The stock market is booming! Buy the dip!” The financial news cycle is practically levitating, boosted by the siren song of cutting-edge AI services, soaring tech valuations, and the general belief that paper wealth equals economic health. Wall Street is throwing a massive party, complete with champagne towers built entirely out of enthusiasm.
But here’s the harsh truth: The current, highly hyped financial cycle—driven by investment buzz and stock prices—is not the same as the business cycle. And while a few mega-cap tech companies might be shooting for the moon, masking the broader economy’s true condition, the real economic gravity is measured far away from Manhattan trading floors, in the grit and steel of Main Street.
If you want a real clue about whether the economy is headed for expansion or an imminent contraction, forget your stock ticker. It’s time to talk about dirt, concrete, factory floors, and why construction and manufacturing GDP data are the ultimate early warning system.
The Great Divide: Main Street Reality vs. Wall Street’s skewed Hopes
Most people associate economic vitality solely with Wall Street, looking at stock market indices for reassurance. However, the business cycle is fundamentally about Main Street—the actual, tangible production of goods and services, including manufacturing, construction activity, and employment.
When markets are focused on financial flows, stock speculation, and the latest software IPOs, they are tracking the financial cycle. This cycle can sometimes become skewed because index numbers, especially the S&P 500, can be dramatically influenced by the performance of just a handful of huge companies. This means a few soaring AI service giants can easily paint a picture of universal economic paradise, even if the engine room of the economy is sputtering.
If you rely solely on these biased financial indicators, you risk confusing speculation for production, and hope for health. That’s why analysts turn to the real pulse of the economy: the manufacturing and construction sectors. These sectors give us a “more neutral and grounded picture” of economic health.
The Unsung Heroes: Why C&M are the Real Indicators
Imagine the economy is a highly sensitive vehicle. GDP, reported quarterly, is like checking the odometer every three months—it’s slow, often delayed, and definitely looking at the past. If you want to anticipate the future path, you need something much faster.
Enter construction and manufacturing. These two sectors are the economy’s mechanical engineers, giving us real-time feedback. They are the backbone of business cycle forecasting for several crucial reasons:
1. Monetary Policy Bellwethers: Both sectors are highly sensitive to monetary policy, such as changes in interest rates. If developers can’t finance huge residential or commercial projects, and manufacturers postpone capital-intensive factory expansions, drops in construction demand, for instance, would swiftly propagate to other sectors.
2. The Secondary Sector Backbone: These industries represent the secondary economic sector, meaning they deal with the actual transformation and production of goods, not just raw resource extraction or intangible services. One might argue that they may account for only about 15% of GDP in the US, but their influence is massive and cyclical.
3. The Timeliness Advantage: Forget quarterly delays. Both construction output and manufacturing employment data are released monthly. This timely, frequent data allows analysts to gauge economic momentum much faster than waiting for delayed GDP reports.
In the US context, some analysts have even titled articles with the bold claim that “Housing is the business cycle”. Swings in residential construction are frequent, large, and drops in activity are almost always associated with a subsequent drop in GDP.
The Analyst’s Secret Weapon: Business Cycle Momentum and the Zero Line
Since looking at raw production numbers can be noisy, the real magic happens when we calculate and track the momentum of this business cycle —meaning, how fast these sectors are growing or shrinking compared to the same period last year.
We combine two key monthly figures to build a this composite business cycle momentum index: the total construction output (spending) and manufacturing employment.1 Both measured by their monthly year-over-year percent change. The construction spending data is reported via the Census.gov and the manufacturing data via the Federal Reserve Bank of St. Louis (FRED). Both datasets provice monthly figures. We use their latest available data until July 2025 (Construction).
This Composite Business Index effectively captures the ups and downs of the economy’s engine.
Cycle analysis results
Looking at this index, two stable, recurring cycles consistently dominate the data: a 67-month cycle (about 5.5 years) and a 109-month cycle (about 9 years). These cyclical patterns help us pinpoint exactly when economic momentum is peaking or bottoming out.

But here is the most important concept in economic forecasting based business cycle momentum: The Zero Line.
Imagine momentum as the speedometer for the economy.
• When momentum is above zero, the engine is revving, and the economy is expanding, even if growth is slowing.
• But when the momentum index crosses below zero, that is the flashing, screaming, red-alert signal. It means that construction and manufacturing are actively contracting compared to the prior year, signaling the start of a downturn or recession.
Historically, this zero-crossing is a powerful early warning sign, often preceding the official recession declaration by the National Bureau of Economic Research (NBER). By using our business cycle index and the identified cycles, we have found a striking correlation: Every single time the composite business cycle momentum index crossed below zero during a downswing in the historical data, the US economy entered a recession shortly after, with no exceptions in the data.
The Structural Shift: A Necessary Caveat
While C&M remain the most reliable leading indicators for the business cycle, it is important to acknowledge that the underlying U.S. economic structure has changed over the past quarter-century.
The relative impact of manufacturing on the U.S. economy declined. Does this structural change make construction and manufacturing less relevant? No. While the overall interdependencies among domestic industries have slightly decreased, meaning a unit of final demand generates less total output domestically, these heavy industries still define the core linkages that transmit economic stress. They are still the early warning system because they are fundamentally cyclical and sensitive to changes in monetary policy.
Final Word: Keep Your Eyes on the Ground
So, the next time Wall Street pundits are celebrating an AI-fueled boom, remember that the true measure of economic health isn’t found in a soaring stock price skewed by a handful of mega-firms.
The clues regarding the real business cycle are far more grounded. They are quietly sitting in the monthly reports of construction output and manufacturing employment changes. When the momentum index built from these core sectors dips below zero, ignore the headlines about financial euphoria and strap in: the real pulse of Main Street is signaling contraction. The business cycle data offers a less biased, more representative, and historically more reliable picture than financial market data for spotting recessions early.
Dancing When the Data Stops
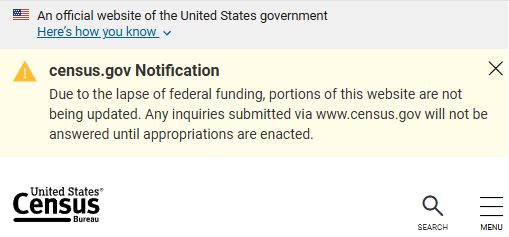
The problem intensifies today when the data itself disappears: Because construction spending data is a key leading indicator and a critical dataset that is reported monthly, its delay due to the current US government shutdown removes the crucial counterpoint to financial optimism. Agencies like the Census Bureau have stopped updating this dataset as of now and it will not be updated until funding resumes. (Source)
Do not mistake Wall Street’s noise for economic reality.
Go ahead, Wall Street, keep the party raging in the dark on “skewed Hopes” until the music stops. You’re dancing in the dark, not just ignoring the signals of contraction in those sectors, but because the crucial Main Street data lights—the economic “Reality”—has now been temporarily silenced by the government shutdown.
Yours,
Lars
Germany, 02. October 2025
Cycles TV: For those who are interested in the full cycle analysis video:
Data sources used to build the composite business momentum index:
FRED: https://fred.stlouisfed.org/graph/?g=1MEsZ
Census.gov: https://www.census.gov/construction/c30/at_a_glance.html