
Unlocking El Niño Cycles to Forecast Global Weather and Economy
A tribute to the UN climate conference COP30 from the perspective of cycle analysis

Discover how cycle analysis of El Niño sea surface temperature anomalies can forecast global weather patterns and impact economies worldwide.
Why Cycles Matter in Global Weather
Have you ever wondered if there’s a hidden rhythm behind the chaos of global weather? Well, there is! In this post, we dive into the fascinating world of cycle analysis applied to climate data—specifically focusing on El Niño sea surface temperature anomalies. We’ll explore how understanding these cycles can not only enhance weather predictions but also inform business decisions and economic strategies.
The El Niño Southern Oscillation (ENSO) is one of the most influential climate phenomena affecting global weather patterns. By detecting persistent cycles within ENSO data, we can improve forecasts of weather events like storms, droughts, and floods. This, in turn, helps industries from agriculture to energy manage risks better. So, buckle up for a deep dive into climate cycles and their surprising economic impact!
What is El Niño and Why Should We Care?
Understanding El Niño and Sea Surface Temperature Anomalies
El Niño refers to periodic warming of sea surface temperatures in a specific region of the southern Pacific Ocean, known as the Niño 3.4 region. Scientists track anomalies, or deviations, from normal temperature levels to understand how El Niño influences weather worldwide.
The baseline, or “normal,” is calculated from historical data over about 23 years. Deviations above or below this line indicate warmer or cooler sea surface temperatures. These anomalies play a huge role in shaping global weather events, like hurricanes, flooding, or droughts. In fact, big swings in these temperatures often foreshadow extreme weather conditions.
The Economic Ripple Effects of El Niño
El Niño doesn’t just mess with the weather; it shakes up economies too. Commodity traders closely monitor ENSO data to hedge risks related to crops, energy, and logistics. Insurance companies use it to prepare for weather-related claims, and even global institutions like the World Bank estimate El Niño’s impact can shave off between 0.5% to 1% of global GDP. That’s a massive economic effect stemming from ocean temperature cycles!
The Science of Cycle Analysis: Beyond Just Length Detection
What is Cycle Analysis?
Cycle analysis is a method used to identify repeating patterns over time within data sets. Traditionally, researchers focused on simply finding the length of cycles, like spotting a 2-year or 4-year recurring pattern in temperatures. But knowing just the length only tells half the story.
Why Length Alone Isn’t Enough
Think about it like this—if you know a wave repeats every 3 years but don’t know where you currently are on that wave, you can’t predict when the next peak or trough will happen. That’s where phase and stability come in.
Phase tells us the current position within the cycle (are we nearing a peak or a low point?).
Stability measures how consistent the cycle’s length and shape are over time.
The Importance of Stability
A cycle that’s all over the place in length or phase isn’t useful for forecasting. For a cycle to be predictive, it needs a stability score above 0.5 (on a scale where 1 is perfectly stable). If it’s lower, the cycle may exist but it’s too erratic to rely on for future predictions.
Applying Cycle Analysis to ENSO Data: The Process
Data Preparation: From Monthly to Weekly
ENSO data typically comes as monthly sea surface temperature anomalies. To get more precise insights, researchers interpolate this monthly data into daily or weekly points, a process called oversampling. This doesn’t change the original data but gives us a finer resolution to detect cycles more accurately.
For example, by oversampling monthly data into weekly data points, we increase the number of observations drastically—from a few hundred to over a thousand—helping the cycle analysis tools perform better.
Detecting Dominant Cycles in ENSO
Using our advanced cycle analysis software, we have identified three dominant cycles in the Niño 3.4 sea surface temperature anomalies. These cycles not only appear clearly in the data but also show high stability. That means they’re reliable patterns that can be used for forecasting.
Visualizing Cycles: How Close is the Fit?
By combining these three cycles, our software creates a composite that mirrors the historical ENSO data almost perfectly. This suggests that the major fluctuations in sea surface temperature aren’t random but are driven by persistent cyclic behavior.
For this example, I am using the NINO3.4 sea surface temperature anomany data. As shown copernicus.eu website1:

Applying our cycle analysis to this data, we reveal 3 dominant cycles which are superimposed on the chart and projected into the future.
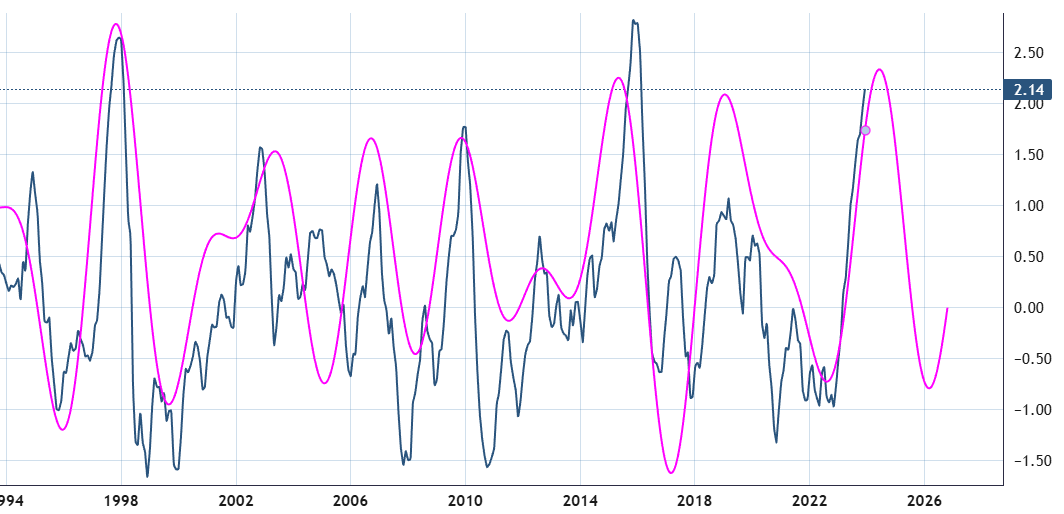
The chart shows the most 3 dominat cycles with a length of 227, 155 and 283 weeks as detected in the ENSO.
Forecasting the Future: What Do ENSO Cycles Tell Us?
Predicting Peaks and Troughs
Based on the current phase of the three stable cycles, the forecast for 2024 showed a peak in sea surface temperature anomalies late 2023 or early in 2024, followed by a decline back to more normal levels into 2025. With an upcoming low early 2026.
This aligns closely with actual observed data, proving the practical power of cycle analysis. This is what happened after fact in the data series2:
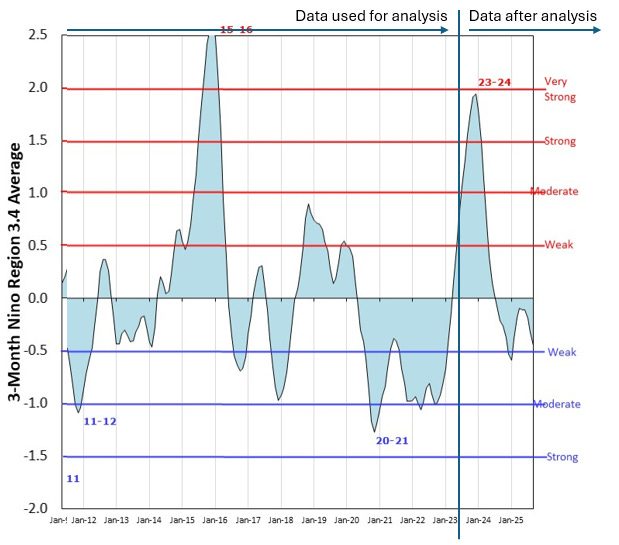
The data peaked as expected by the dominant cycle at the end of 2023 and moved downward back to neutral levels into 2025. So we are just awaiting the next possible upswing starting early 2026. We will see.
Limitations and Real-World Considerations
While cycle analysis gives us a reliable rhythm, it doesn’t predict the exact amplitude (how strong the anomaly will be). Also, forecasts are best limited to one or two turning points ahead, since cycles can shift over longer time frames.
Why This Matters: Economic and Environmental Impacts
Business Applications of ENSO Cycle Forecasting
The ability to forecast ENSO anomalies with better precision can revolutionize risk management. Commodity traders can fine-tune hedging strategies based on expected weather disruptions. Energy companies can anticipate demand fluctuations caused by weather. Logistic firms can plan for potential delays from storms or flooding.
Helping Climate Scientists and Policymakers
Cycle analysis tools speed up research by quickly identifying stable climate patterns, allowing scientists to focus on interpreting impacts rather than spending months hunting for cycles. Policymakers can use these insights for disaster preparedness and infrastructure planning.
Final Thoughts: The Future of Cycle Analysis in Climate Science
Cycle analysis is proving to be a powerful tool in understanding and forecasting global weather dynamics like El Niño. By combining advanced technology with accessible data sets, we can improve predictions that affect not only the planet but economies worldwide.
If you’re intrigued by how cycles shape our climate and want to explore further, dive into cycle analysis tools and share your findings. The more minds working on this, the better we can prepare for—and maybe even mitigate—the wild swings of global weather.
You can watch the detailed analysis here:
Nino 3.4 Sea Surface Temperature time series, Source: https://data.marine.copernicus.eu/product/GLOBAL_OMI_CLIMVAR_enso_sst_area_averaged_anomalies/description
https://climate.copernicus.eu/climate-indicators/sea-surface-temperature