
The Grand Alignment: How Global Liquidity Cycles Drive Bitcoin's Rhythm
Revealing how the synchronization of long-term (65-month) and short-term (200-day) Global Liquidity cycles systematically influences Bitcoin's macro-sensitive movements.


The fundamental thesis is that the dominant cycles characterizing Global Liquidity, not conventional money supply figures or isolated U.S. dollar trends, are the paramount forces dictating Bitcoin's price and its developing role as a value store sensitive to macroeconomic shifts. Given that these dominant cycles can be identified as both long-term and short-term, a more detailed analysis of this data is essential. This publication is a collaborative endeavor between Capital Wars / Michael Howell and the Foundation for the Study of Cycles / Lars von Thienen, aimed at performing a cyclic analysis on the Global Liquidity Bitcoin Basket.
CrossBorder Capital is a London-based, FCA-regulated, independent fund management firm. Founded in 1996 by Michael Howell, CrossBorder Capital developed a reputation as an independent investment advisory and macro research firm specializing in the monitoring of Global Liquidity Flows. The firm's expertise lies in dissecting the complex interplay between global capital flows and asset valuations. Dr. Michael J. Howell has worked in finance for over 30 years. Formerly Research Director at Salomon Bros., where he developed the concept of 'Global Liquidity', he is the author of 'Investing in Emerging Markets' and 'Capital Wars'. He also provides regular updates in his blog Capital Wars.
The Foundation for the Study of Cycles, (“FSC”) a non-profit established in 1941 by economist Edward R. Dewey, focuses on discovering, analyzing, and applying recurring patterns in nature, markets, and society. Its work is premised on the principle that cycles persist, revert after distortion, often synchronize, and tend to have counterparts across various disciplines. Lars von Thienen, a leading expert in cycle analysis, is known for developing algorithms for cycle detection and forecasting in financial time series. He has developed a platform for cycle-based analysis and serves as a Board Member of the Foundation for the Study of Cycles. Von Thienen has also published two books on the subject and actively shares his analyses with the public at cycles.org.
Mechanisms Linking Global Liquidity to Bitcoin Prices
The price action of Bitcoin is systematically tied to macro-financial forces, with Global Liquidity identified as the paramount driver. This connection is not merely a correlation but a causal relationship, where Global Liquidity actively influences Bitcoin's movements.
Unlike traditional measures like World M2 money supply, which primarily track retail deposits, Global Liquidity is a wholesale measure that focuses on the asset or credit side of the financial system. It captures the capacity of the entire world financial system to create credit and facilitate transactions. This is crucial because, as noted by Henry Kaufman, "Money matters, but credit counts". Global Liquidity is far larger than M2, sometimes by as much as two and a half times.
Global Liquidity takes an international perspective, considering liquidity created by multiple monetary authorities, including central banks outside the US like China's PBoC. It also accounts for private sector credit provision through various channels, such as banks, repo markets, and shadow banks. Importantly, it embraces the concept of the "collateral multiplier," acknowledging that liquidity can be created outside traditional banks and is fungible.
The financial system is currently characterized by a "debt-refinancing loop," where approximately 75% of transactions involve refinancing existing debt. This environment creates a strong dependency on collateral (e.g., Treasuries, high-quality bonds) and the overall balance sheet capacity, which is precisely what Global Liquidity measures.
In this debt-dominated system, policymakers face the necessity to continually expand liquidity to prevent crises that could arise from collateral shortages and rollover risks. This constant expansion of liquidity in the broader financial system, aimed at preventing instability, makes assets that can hedge against currency debasement, such as Bitcoin and gold, highly attractive.
Statistical analysis of ten years of weekly data shows that Global Liquidity systematically influences 41% of Bitcoin's movements. 1
Furthermore, Global Liquidity "Granger causes" (meaning it has predictive power over) movements in Bitcoin (and gold), while World M2 does not. This stronger and more robust predictive relationship confirms Bitcoin's greater sensitivity to Global Liquidity.
Bitcoin is increasingly behaving as a macro-sensitive store of value that responds to cycles in Global Liquidity, rather than just relative trade flows or static currency influence. It is not tied to trade flows or GDP, but rather responds to the global cost of capital, collateral availability, and overall liquidity conditions.
Before discussing the connection between Global Liquidity and Bitcoin further, let's examine another crucial characteristic of Global Liquidity: its cyclical nature.
Timing the Liquidity Cycle: Long term 65-month cycle
The financial system's reliance on a "debt-refinancing loop" further highlights this cyclical dependency, where policymakers need to continually expand liquidity to prevent crises. It is a long-term swing in Global Liquidity that has been identified as having a 5-6 year period, specifically around 65 months.
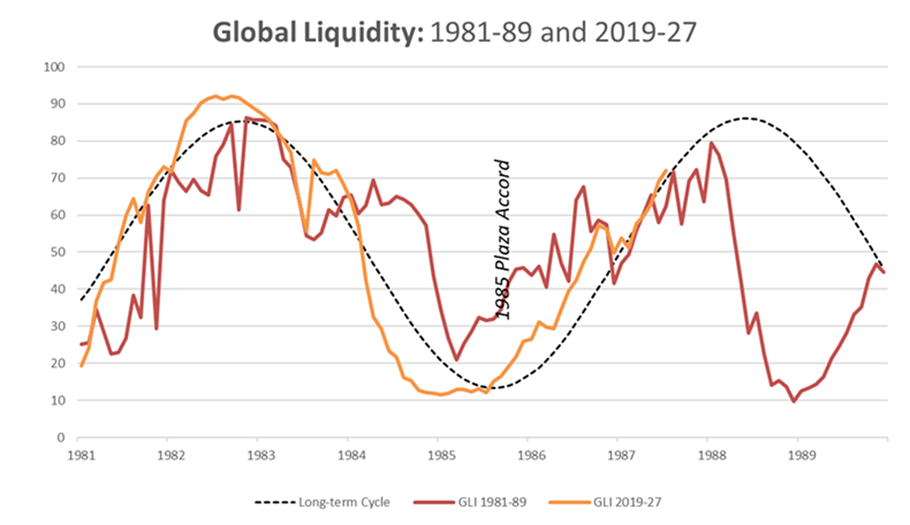
The cycle of Global Liquidity is shown in the following chart. Global Liquidity is measured here as a normalized index (GLI), which essentially captures its momentum.

According to the extrapolated data, the Global Liquidity Cycle should next peak around September 2025, following its December 2022 trough.
This cycle was first identified through Fourier analysis, with initial studies dating back to the year 2000. Independent analysis by Lars von Thienen from The Foundation for the Study of Cycles confirmed these original findings and even added a second important cycle frequency at 76 months (6.3 years).
This cycle is argued to likely resonate with a frequency similar to the average maturity of World debt. In essence, it represents the cycle of debt refinancing.
Given that the financial system is currently in a "debt-refinancing loop" where about 75% of transactions involve debt rollovers, policymakers face a continuous need to expand liquidity to prevent crises driven by collateral shortages and rollover risks. This cyclical demand for liquidity is a key driver, making assets like Bitcoin and gold attractive as hedges against currency debasement.
The 5-6 year global liquidity cycle is a recurring pattern in the expansion and contraction of global credit, closely tied to the refinancing of the world's debt, which compels policymakers to manage liquidity dynamically.
The current Global Liquidity cycle is not only getting mature, but it is also starting to look remarkably like the mid-1980s cycle that ended in the 1987 Crash in World stock markets.
Understanding the significance of Global Liquidity, its cyclical nature, and its direct impact on Bitcoin prices has led to the introduction of an improved metric for evaluating global Bitcoin valuations.
Introducing Global Liquidity Bitcoin Basket (GLI-BB™)
To better understand the liquidity dynamics related to Bitcoin, the Global Liquidity Bitcoin Basket (GLI-BB™) was introduced. 2
The GLLI-BB is a new benchmark designed to evaluate Bitcoin's value within the broader global monetary system, moving beyond the traditional view of Bitcoin solely against the US dollar (BTCUSD). It is a liquidity-weighted effective exchange benchmark for Bitcoin that aggregates Bitcoin's performance against a basket of 15 major fiat currencies, including the US dollar, euro, Japanese yen, and Chinese yuan.
Crucially, instead of using fixed weights or weights based on trade flows or GDP, GLI-BB™ applies variable weights based on each currency's contribution to Global Liquidity. These weights reflect the influence of central bank balance sheets, cross-border capital flow dominance, and global reserve status, constantly adjusting to reflect the true monetary architecture that governs cross-asset pricing. This is vital because Bitcoin is increasingly behaving as a macro-sensitive store of value whose performance is tightly linked to cycles in Global Liquidity, not static currency influence or trade flows.
The new index offers a structurally grounded measure of Bitcoin’s value that directly reflects changes in global liquidity conditions. This helps investors contextualize Bitcoin's price movements as outcomes of shifts in the underlying monetary regime, rather than isolated volatility. Investors are able to separate broad-based Bitcoin moves from those driven purely by changes in US dollar liquidity.
As Bitcoin's volatility naturally declines over time, the influence of these broader fiat liquidity dynamics grows, making GLI-BB™ essential for understanding how Bitcoin is transitioning from a speculative asset to a store of value that responds to global liquidity. It uncovers macro signals that BTCUSD alone cannot.
Timing the Bitcoin Basket - Short term 200-day cycle
Bitcoin's performance is more tightly linked to cycles in Global Liquidity than to other factors like trade flows or static currency influence. The 5-6 year (65-month) prime-driver cycle in Global Liquidity, which represents the cycle of debt refinancing, is a fundamental force in the macro-financial system. This Global Liquidity is identified as the paramount driver of Bitcoin's price action, systematically influencing 41% of its movements.
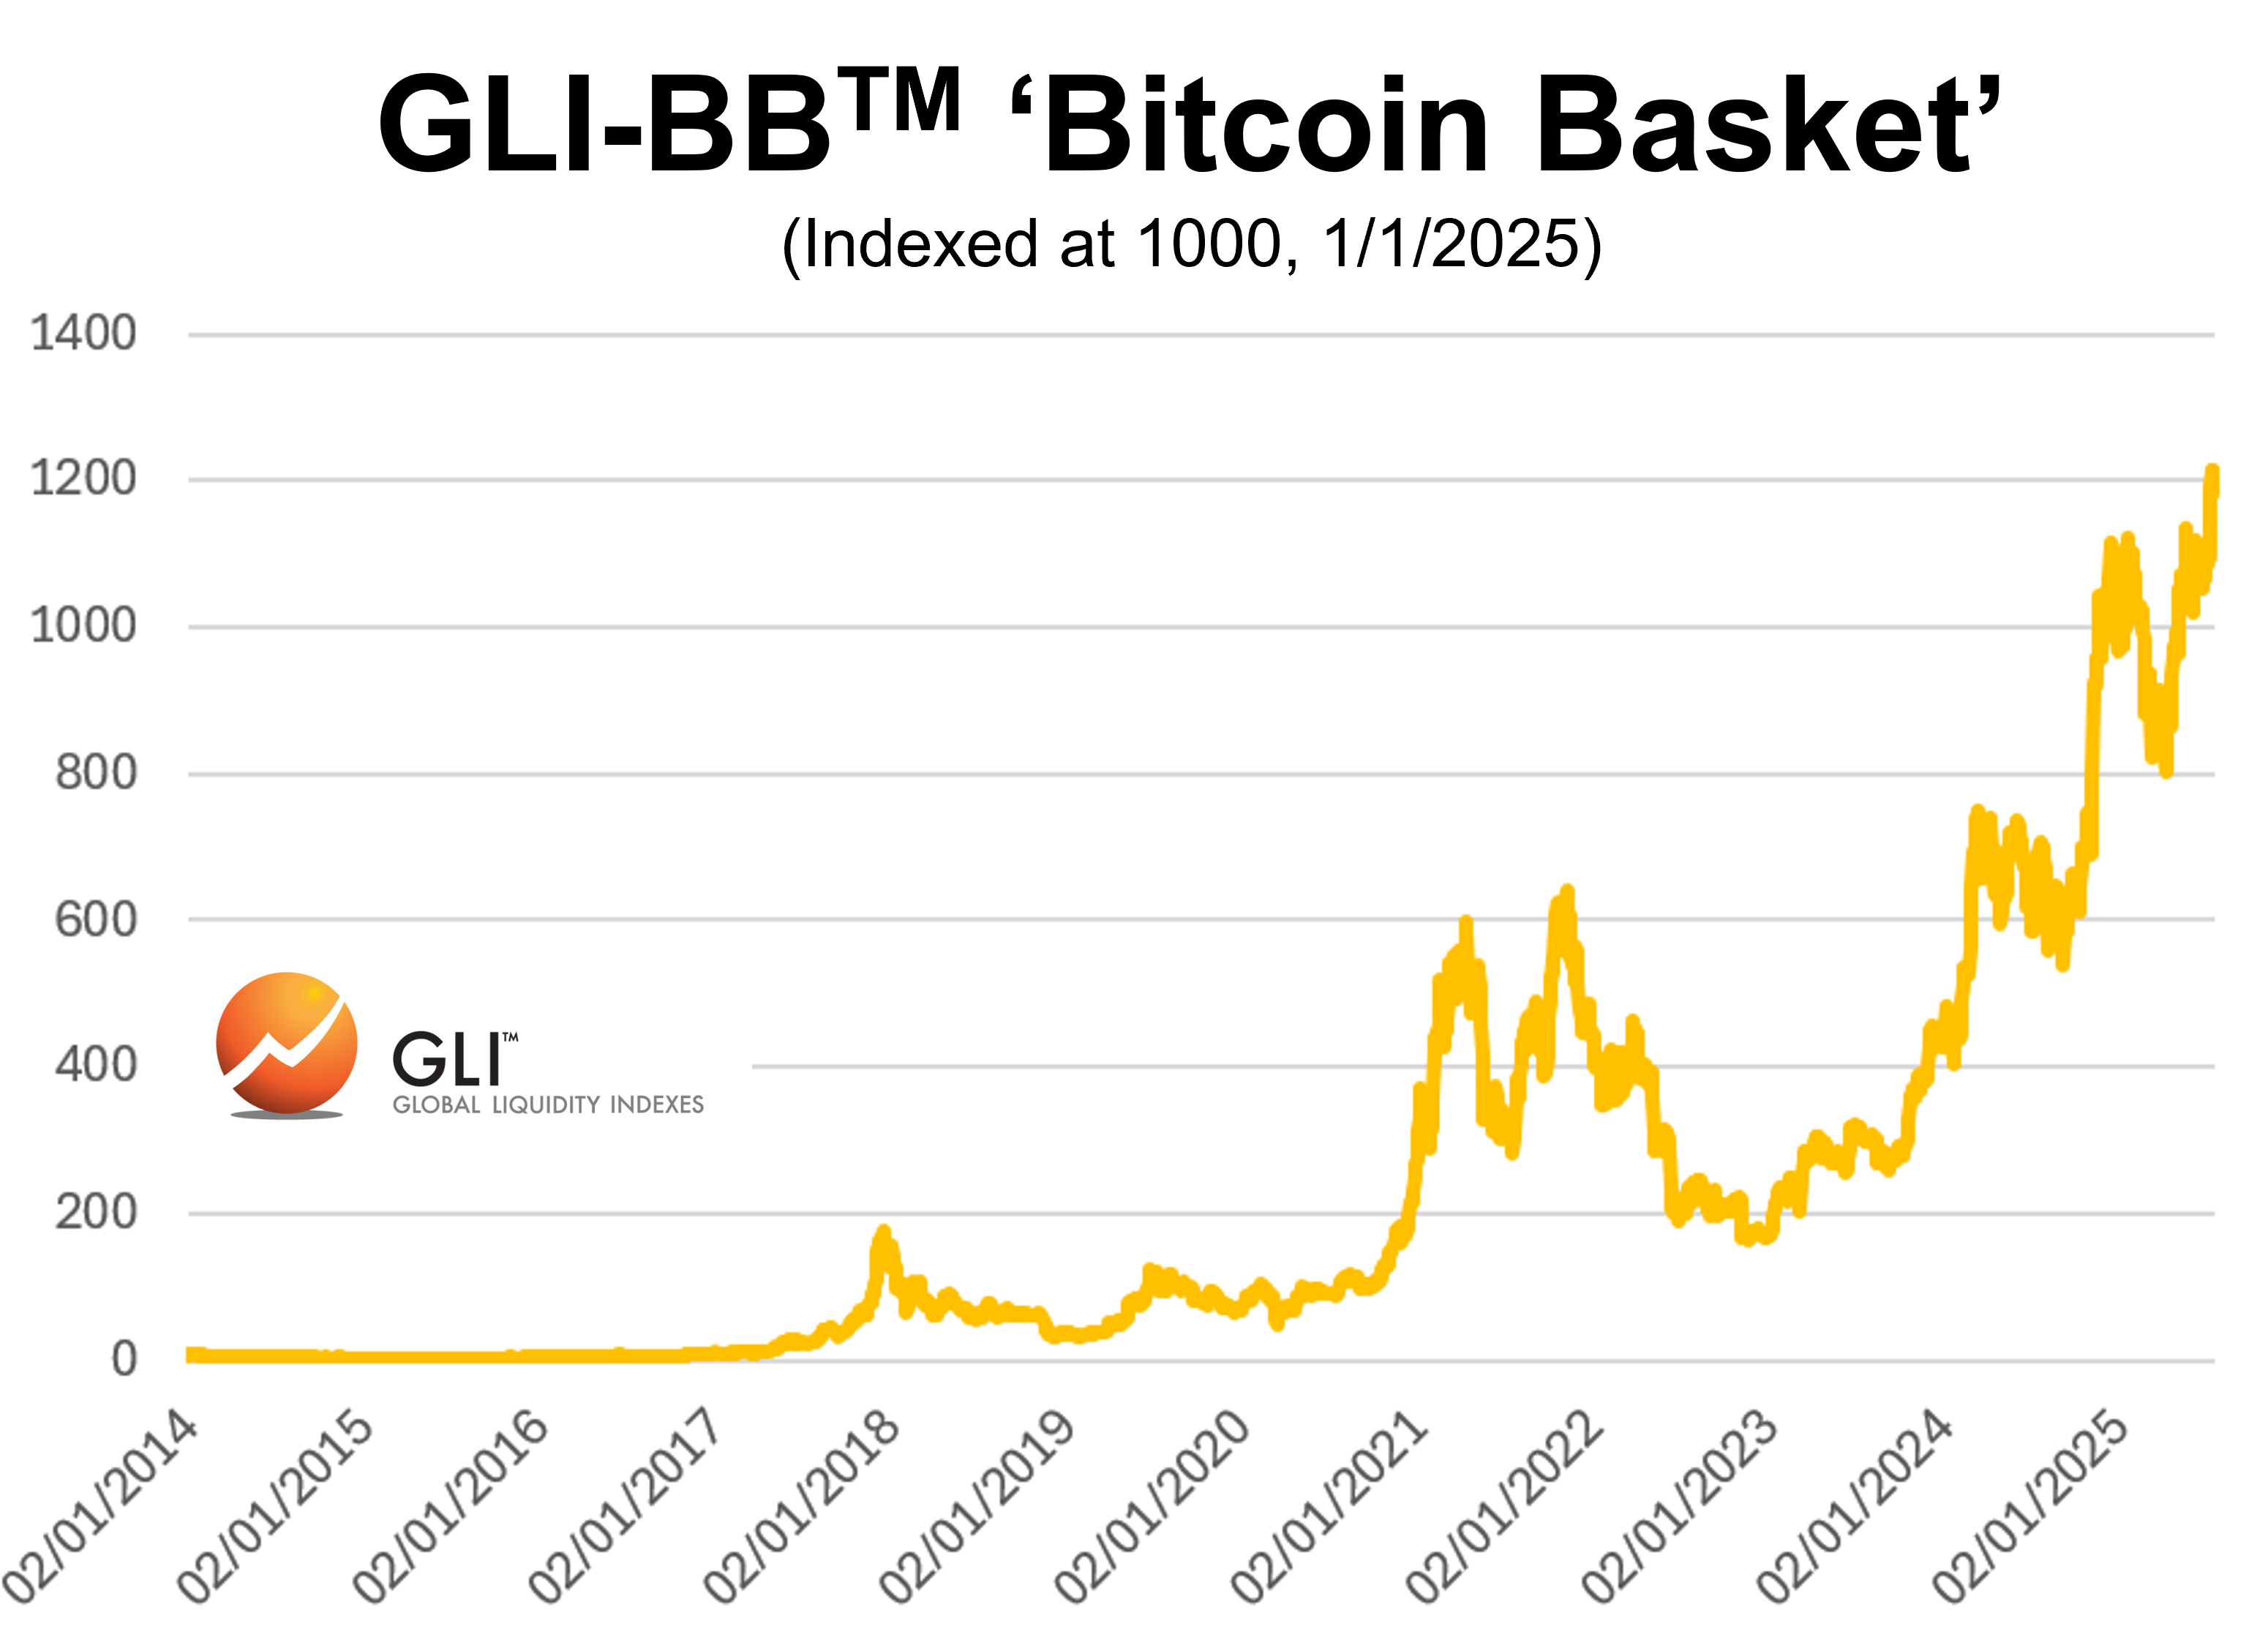
The latest data indicates that this GLI long-term prime-cycle is nearing its peak. With the GLI Bitcoin Basket dataset now available, we can begin analyzing shorter-term cycles. Examining these cycles on a daily basis will provide more precise timing for significant shifts in global fair Bitcoin pricing. We have conducted a more detailed cycle analysis using the current GLI BB dataset. The following chart shows the GLI-BB from 2017 to 2025 as daily data series.

Utilizing digital signal processing techniques, including de-trending, a cycle analysis has uncovered three prominent cycles with durations of 140, 164, and 202 trading days. As the data excludes weekends, the indicated lengths should be understood as trading days, not calendar days.

These three time-cycles exhibit considerable stability over time, meaning their variations in length and phase are minimal. This stability is a crucial prerequisite for applying these cycles to price charts.
The next chart presents a synthesized cycle derived from these three dominant cycles, overlaid onto the GLI BB data series. Additionally, a zig-zag curve is superimposed on the price at moments when the composite cycle shifts its direction. These zig-zag turns vividly illustrate that these three cyclical components effectively account for nearly all trend changes in the global liquidity bitcoin basket over the last decade of observation.

The analysis indicates a projected trend reversal around late August 2025, with the composite cycle anticipated to shift downwards towards the year's end. This downturn could suggest that the recently achieved all-time high might precede the next market correction. This observation gains further significance when considering a "cycles-within-cycles" analysis. We already know the long-term 65-month Global Liquidity cycle is nearing its peak, expected between September and year-end. Coupled with the concurrent downward turn of the short-term composite cycle, the alignment of these long- and short-term cycles amplifies their predictive power, as cycles tend to be more impactful when their phases synchronize.
The nominal 200 calendar days cycle in action
The 140-weekday cycle within the GLI-BB provides even more compelling insights. Considering a full calendar including weekends, this 140-weekday-cycle equates to a length of 196-calendar-days.
This is particularly fascinating when recalling previous analyses of the BTC-USD series, which highlighted the nominal 200-calendar-day cycle as the most significant indicator at cycle tops. This 200-day cycle, extensively documented by the FSC over recent years, was instrumental in forecasting the major low and subsequent upswing in early 2023 when Bitcoin was valued at $16,000 USD. At that juncture, the 200-day cycle signaled the commencement of the next substantial upward trend, initiating the rally that has persisted until the present, with approximately five iterations of the 200-day cycle aligning closely with current timing. The FSC analysis also indicated a projected major top for summer 2025.3
With the GLI-BB data and cycle analysis now available, confidence in this projection is increased, as the 196-calendar-day cycle (= 140 trading days), mirroring the nominal 200-calender-day cycle, is clearly discernible within the GLI Bitcoin Basket. The following chart shows the 140-trading-day cycle now plotted as 196-calendar days on the GLI BB data.

By looking at the most dominant cycle, this cycle has just topped with the index making a new all-time high. This cycle now not only confirms the importance of a nominal 200-day cycle in Bitcoin, it also validates that the 5th iteration of this cycle since the major low in 2023 has now arrived.4
Summary
Long-term cycles are key to understanding Global Liquidity. Shorter cycles are also evident in BTC-USD data. Now, with the stable GLI-BB index, we can analyze these short-term cycles globally, independent of specific fiat currencies. Data analysis shows a "cycles-within-cycles" alignment between the long-term 65-month cycle and the shorter nominal 200-calendar day cycle, occurring now. To truly comprehend the newly introduced GLI-BB data series and its cyclical behavior, a more profound exploration of Global Liquidity, Bitcoin, and their interlinked cycles is essential. We eagerly anticipate further detailing our joint efforts on this subject between Michael Howell and the Foundation for the Study of Cycles.
Warm regards,
Lars von Thienen
Michael Howell
References & Further Reading:


 | A guest post by
|