Will Bitcoin ever recover or will the crypto winter last forever?
The 1-million-dollar question - What do cycles tell us?
Dear Market Cycle readers,
I want to provide a long-term cycles update on Bitcoin/USD. It looks like we are approaching an important cycles formation from now until May this year. This window and pattern could act as the next launch pad for the Bitcoin/USD.
The Bottom Line
The cyclic pattern suggest that Bitcoin should approach the next low between now and May 2023. Afterwards, a next long-term upswing could start.
Review - The Background
In the summer of 2021, I did a long-term analysis of the cycles in Bitcoin. Retrospectively, I analysed all previous important highs and lows since 2010 with regard to the active cycles. Above all, my interest centred on the question of whether important cycles were detectable before the parabolic movements and whether they could point to a possible upward price trend?
Surprisingly, I was able to identify several cycle patterns in this long-term analysis covering almost all historical important BTC/USD turning points. I published these patterns in the summer of 2021. At the same time and based on these findings, I published the following projection for the bitcoin price based on this analysis:

In the video, the following projection was made: (as seen in the chart from the video):
At the day of the analysis (June ‘21), BTC is forming a low & next upleg is expected
Top should be expected for ~Oct. ‘21, based on the dominant cycle of 193 days
This next top would markt the count no. 5 of this cycle pattern as major high
Expecting BTC/USD price to drop after count #5 by around 70%-90% afterwards
Here, the outcome of this cycle analysis after the fact is shown with green color and grey price data. The #5 final top projection was made on June 2021.

Just pure facts here. Cycles predicted the final upswing in Summer 2021 and warned us in advance that we could expect the next 80% downmove afterwards. It happened - unbelievable.
Or, in simple terms:
“There are no gurus, only cycles.”
But long story short. You can review the full video mentioned above on your own for the long-story.
Here are the key findings of that analysis which are still valid for today:
The 4 important key cycle patterns in BTC/USD price action
There is presence of a nominal 200 calendar days (+/- 10%) cycle prior to all past parabolic moves in Bitcoin USD price since 2010.
The final leg of the final up move could be projected by the 5th repetition of the nominal 200cd cycle 3-6 month ahead of time.
After the final last up move based on 5th repetition, Bitcoin price lost 70-90%.
The following long-term low was aligned with the 3rd repetition of the 200cd cycle.
Let us briefly summarise the individual results before making a new forecast based on today's data.
The Importance of the 200-day nominal cycle
At each point in time before major up-moves occured, cycle analysis always revealed a nominal cycle with a length of 200 trading days projecting the timing for the upmove before each move occurred.
At every given point prior to these moves, the cycle spectrum very clear showed a dominant cycle peak around the nominal length of 200 days.
(For our subscribers: all following BTC cycle workbooks are available for your review with the cycles app for free in the subscribers section at the bottom of the article.)
Situation 1: Projection and outcome | early 2013:
Cycle analysis was done on 20 Jan. 2013 and BTC trading at 15 USD. Revealing the dominant cycle with length of 231 days, cycle overlayed above the price chart. Light blue price data is after the fact.
Dominant cycle projected an upswing into early 2013. Price moved from 15 to 200 USD in expected time window.

Situation 2: Projection and outcome | late 2013:
Updated cycle analysis on 12. Oct. 2013 revealed dominant cycle length change to 221 days with updated overlay projection plot. BTC trading at 142 projecting the next upswing to start and end late 2013. (light blue data after the fact)

Cycles projected upswing with correct timing as BTC/USD moved from 140 to 1200 - top was hit on projected time late 2013.
Situation 4: Projection and outcome | 2017:
Cycle analysis was done 15. July 2017 with dominant cycle length of 180 days and next upswing timing from Sept. 2017 into late 2017 with projected top.

Bitcoin price moved from 1900 to 20k in projected upswing timing window, topped as predicted in Nov. 2017.
Situation 4: Projection and outcome | 2021:
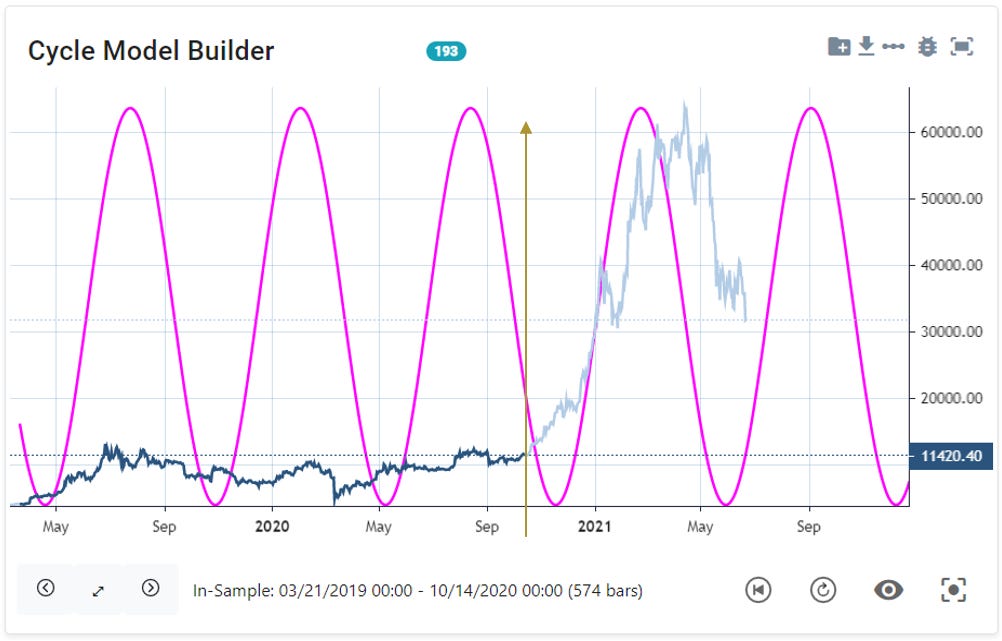
On 14. Oct. 2020, dominant cycle was detected with a length of 193 days and projecting the next upswing into early 2021. Price moved from 11k to 60k in projected timing window. Topped at 60k on projected time and moved into next low mid May 2021. Cycle update was recorded in June 201 with the final top projection into Oct. 2021.

Bitcoin price moved from 11k to 20k in projected timing window.
Summary 1:
The dominant cycle length have been 180, 193, 221 and 231 days - a nominal 200 days cycle. All have been visible in the cycle spectrum ahead of the price moves.
The Importance of the 200-day nominal cycle patterns with count #5 and count #3
The long-term analysis gave us the certainty that the 200d cycle always contains the "master rhythm" of the BTC/USD price movement. Please note that we are talking about time cycles, not cycles that project price targets.
Whenever we can identify a valid "200d" nominal cycle in the Bitcoin/USD cycle spectrum, we know from historical analysis that this is a valid and dominant cycle for that asset.
However, in my analysis I found two other very important findings. The first finding showed a pattern of the 200d cycle before a final top is reached. More specifically, the 200d cycle repeated itself five times before a final, major top formed in the bitcoin price.
The “count of 5” before a final top arrives
The pattern:
The expected top for the final up leg could be projected by the 5th repetition of the 200cd cycle 3-6m ahead of time.
Lets now quickly review this pattern from all major up-moves of BTC/USD:
The 2011 to 2014 up-move:
Bitcoin reached the final top at 1200 on top cycle count 5 in Dec. 2013, dropping 70% after that count was completed.
The 2015 to 2017 up-move:
The next upswing from 2015 to 2017 ended at cycle top repetition #5 at Nov. 2017. BTC dropped 80% after this count was completed.
The 2018 to 2021 up-move*
Keep in mind that this “count of 5” projection was done before the fact in June 2021. We anticipated the next repetition of the cycle top count 5 to be reached in October 2021.
After the cycle count was completed in Oct. 2021, BTC dropped again by 75% from 70k to 17k.
The “count of 3” to spot the bottom
Not only that a clear pattern of the nominal 200-day cycle for the final top became visible. Also, the timing of the low after one of these highs can be identified by a cycle pattern.
After up move #5, Bitcoin price lost 70-90%. The expected major low after the top was aligned with the 3rd repetition of the 200cd cycle low.
(approx. 1y 3m ~ 1y 6m after count #5)
The 2013 top: the low came in after 3rd nominal 200d repetition:
The 2017 top: the low came in after 3rd nominal 200d repetition:
Ok, enough talking. Now after the summary. Let's use these patterns for today's analysis.
Live Cycles Update 2023
» When does the winter end?
Now lets see if this pattern can help us revealing the current status of the current Bitcoin price and the next expected direction and timing information. And even more important: Can we answer the 1-million-dollar question about when the crypto winter will come to an end?
Question 1:
Is the 200d nominal cycle still active and visible in the cycle spectrum today?
Let’s have a look at the current cycle spectrum:
Answer 1:
Yes, we can cleary see the valid dominant cycle of 204days in the spectrum.
Let’s use this information with the current phase of this cycle and plot and overlay with a projection into the future:
I have indicated the last “count of 5” arrival at 70k in Oct/Nov. 2021. As projected by the cycle pattern, BTC was expected to drop again 70% after that time. And we knew from the cycle pattern “count of 3” that we need to wait 3 repetitions of this cycle before the downtrend will find a bottom.
We are close to the end of the “count of 3” pattern now. The theoretical “count of 3” based on the current dominant cycle of 204 trading days ends around April this year.
Again, based on the same pattern that predicted the top with public analysis back in 2021.
So here you have the answer to the 1-million-dollar question:
If this pattern repeats, it seem to be an interesting point in time for the next 2-3 month to accumulate BTC/USD now until May 2023 before the next important long-term upswing cycle phase comes into play again.
Some technical charts and links to the cycle workbook can be found below for the professional subscribers of this blog.
Anyhow, I hope you enjoyed this analysis with an very interesting timing ahead of us.
Regards,
Lars
© 2022 marketcycles.blog, Lars von Thienen, All Rights Reserved.
Any reproduction, copying, or distribution, in whole or in part, is prohibited without permission from the publisher.
Information contained on this site is obtained from sources believed to be reliable, but its accuracy cannot be guaranteed. Lars von Thienen “marketcycles.blog” is a publisher of scientific cycle analysis results for global markets and is not an investment advisor. The published analysis is not designed to meet your personal circumstances – we are not financial advisors and do not give personalized financial advice. The opinions and statements contained herein are the sole opinion of the author and are subject to change without notice. It may become outdated and there is no obligation to update any such information.
Any projections, market outlooks or estimates herein are forward looking statements and are inherently unreliable. They are based upon certain assumptions and should not be construed to be indicative of the events that will occur.
Investments should be made only after consulting with your financial advisor and only after reviewing the prospectus or financial statements of the company or companies in question. You shouldn’t make any decision based solely on what you read here.
Neither the publisher, the author nor any of its affiliates accepts any liability whatsoever for any direct or consequential loss howsoever arising, directly or indirectly, from any use of the information contained herein.
Links to cycle workbooks


