
The Sun’s Hidden Hand: How Sunspot Cycles Shape Financial Markets, Recessions, and Even Hurricanes
An exploration of the surprising — and measurable — relationship between solar activity and economic life on Earth.

This article is based on a YouTube live episode of FSC Cycles TV featuring
Lars von Thienen and Tom McClellan from March 16. 2026.
Most investors spend their days parsing earnings reports, tracking Federal Reserve minutes, and watching employment data tick by tick. Very few think to look 93 million miles away — at the sun — for clues about where the economy is heading next. But perhaps they should.
In a recent episode of Cycles TV, hosted by Lars von Thienen of the Foundation for the Study of Cycles, market analyst Tom McClellan presented a compelling body of research connecting the roughly 11-year sunspot cycle to Treasury yield spreads, unemployment rates, hurricane frequency, and episodes of social upheaval. The correlations are striking, the methodology is transparent, and the forward-looking implications deserve serious attention from anyone making investment decisions in the years ahead.
This article unpacks the key findings from that conversation, explains the analytical framework behind them, and examines what the data suggest about the economic and geopolitical landscape through 2027 and beyond.
A Quick Primer on the Solar Cycle
The sun is not a static furnace. Its energy output oscillates on a cycle that averages roughly 11 years, though individual cycles can range from about 8 to 14 years. The most accessible measure of this variability is the sunspot count — a record that stretches all the way back to 1749, when an early astronomer first began systematically logging the dark spots visible on the solar disk through a filtered telescope.
During the active phase of the cycle, sunspot counts soar, solar flares intensify, and the sun’s electromagnetic output increases markedly. During the quiet phase, the sun settles into a calmer state with minimal surface activity. Modern solar scientists have far more sophisticated instruments at their disposal — X-ray measurements, coronal mass ejection tracking, and detailed magnetic field mapping — but the sunspot count remains the longest continuous dataset we have, and it serves as a practical proxy for the sun’s overall activity level.
The current solar cycle #25 peaked in October 2024. Sunspot counts are now declining, which places us in the early stages of the descending phase — a position with meaningful implications for the topics discussed below.
The Yield Curve and the Three-Year Lag
McClellan’s central observation involves the spread between the 10-year and 1-year U.S. Treasury note yields — a standard measure of the yield curve’s steepness. When this spread is high, long-term rates far exceed short-term rates, typically reflecting a period when the Federal Reserve has cut rates in response to economic weakness. When the spread inverts (goes below zero), short-term rates exceed long-term rates, usually because the Fed is tightening to combat inflation.
What makes the analysis remarkable is the overlay: when you shift the sunspot count forward by approximately three years and plot it against the yield spread, the two series track each other with surprising fidelity. Sunspot peaks, lagged by three years, correspond to peaks in the yield spread. Sunspot troughs correspond to yield spread troughs.
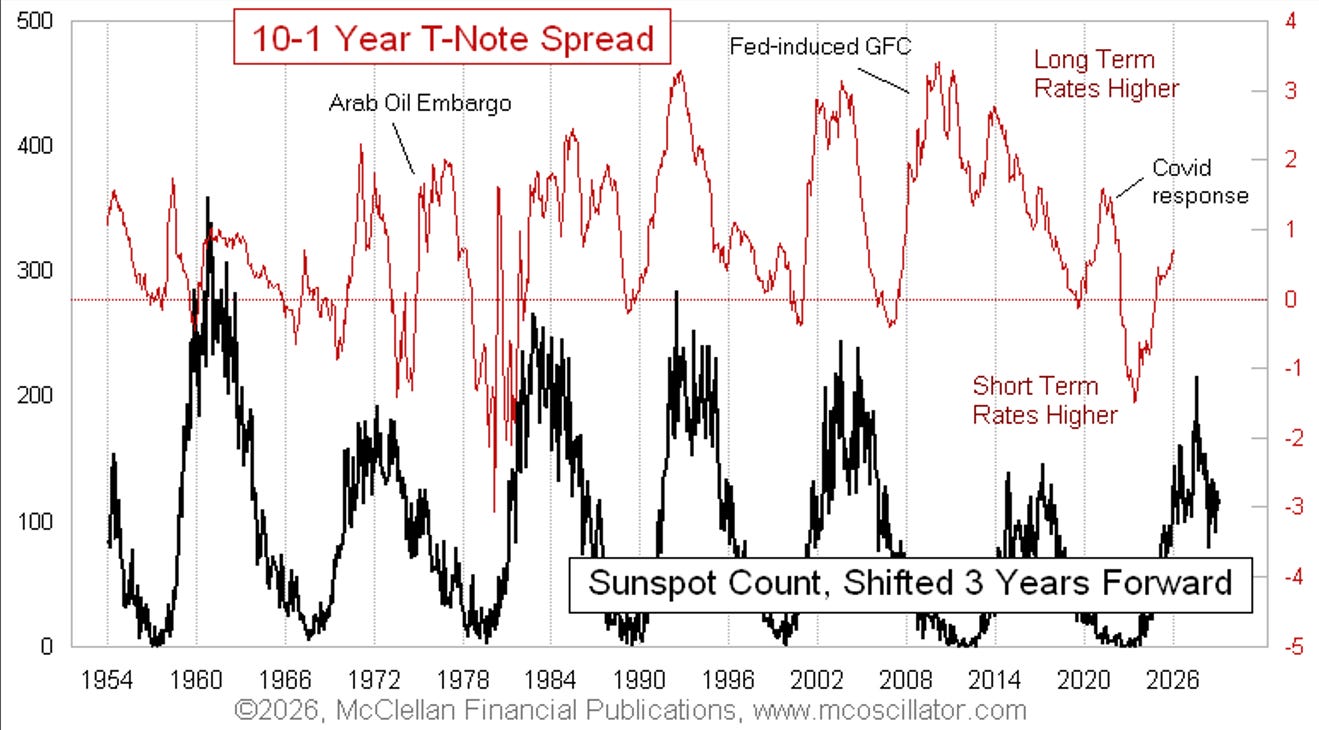
The three-year lag is a critical detail. McClellan did not arrive at it by assumption — he tested multiple lag periods and found that roughly three years (with some natural variation around 2.8 to 3.2 years) produced the most consistent alignment. The fact that this is a leading relationship adds weight to the argument: it is difficult to argue that the yield curve is causing sunspot activity. The more natural interpretation is that the sun’s output is, through some mechanism, influencing economic conditions on a delayed basis.
There are, of course, exceptions. The Arab oil embargo of the mid-1970s, the 2008 Global Financial Crisis (exacerbated by the Fed keeping rates artificially low for too long under Greenspan), and the COVID-19 pandemic all disrupted the otherwise smooth correlation. But here is the telling part: after each of these exogenous shocks passed, the relationship reasserted itself. The natural rhythm returned.
Right now, the yield curve is steepening — short-term rates are falling while long-term rates hold elevated — which aligns precisely with what the three-year-lagged sunspot model predicts. If the model holds, this steepening trend should continue toward a peak around 2027, roughly three years after the 2024 sunspot maximum.
Unemployment Follows the Same Rhythm
McClellan extended the same analytical framework to the U.S. unemployment rate, and the results are equally compelling. Using the identical three-year forward shift of sunspot data, sunspot minimums align with unemployment minimums, and sunspot maximums align with unemployment maximums.
The logic chain is intuitive: as the economy weakens and unemployment rises, the Fed cuts rates, steepening the yield curve. Both phenomena — rising unemployment and a steeper yield curve — dance to the same solar drummer, just three years behind.
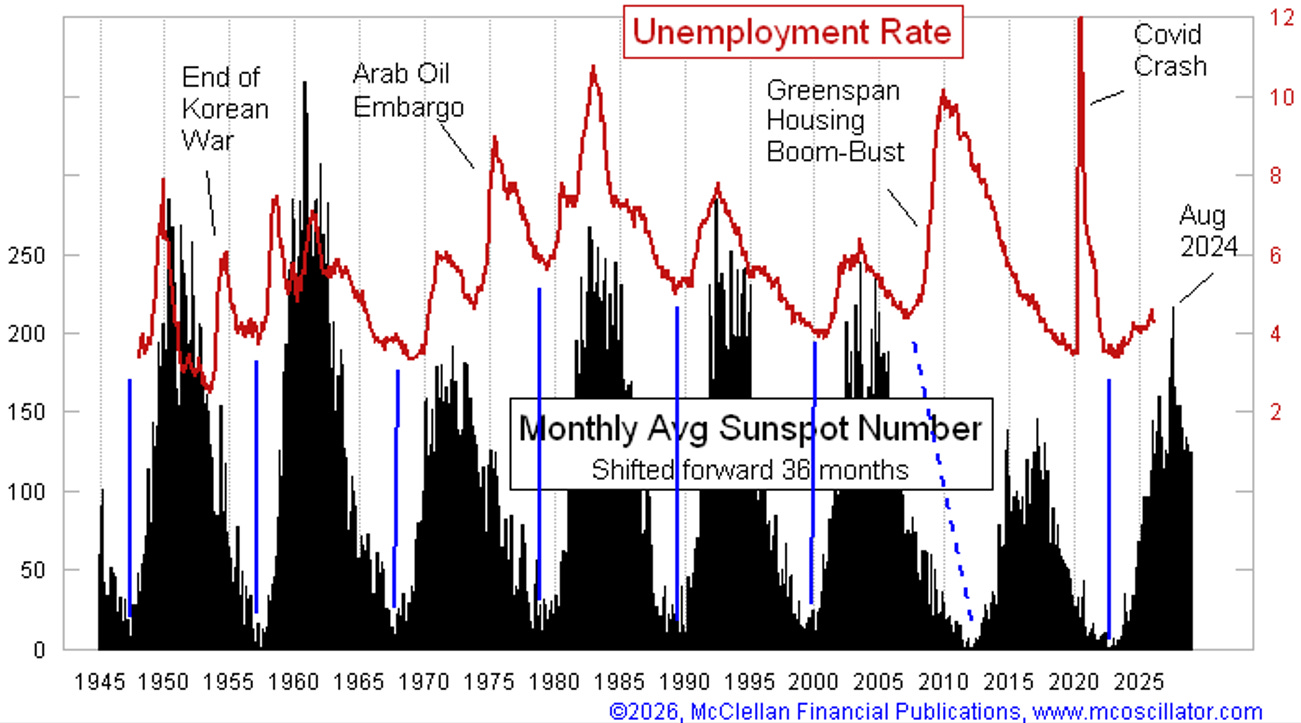
Again, the model is not perfect. The distortions introduced by Greenspan-era monetary policy, the 2008 financial crisis, and the COVID spike are visible in the data. But if you mentally set aside those singular events, the underlying rhythm is unmistakable.
The practical takeaway? Based on this framework, unemployment should continue rising through approximately August 2027 — three years after the 2024 sunspot peak — before beginning to decline. That timeline carries obvious political implications: the economic headwinds through 2026 and into early 2027 are likely to create a challenging environment, with recovery potentially becoming visible only as we approach 2028.
Digital Signal Processing Confirms the Pattern
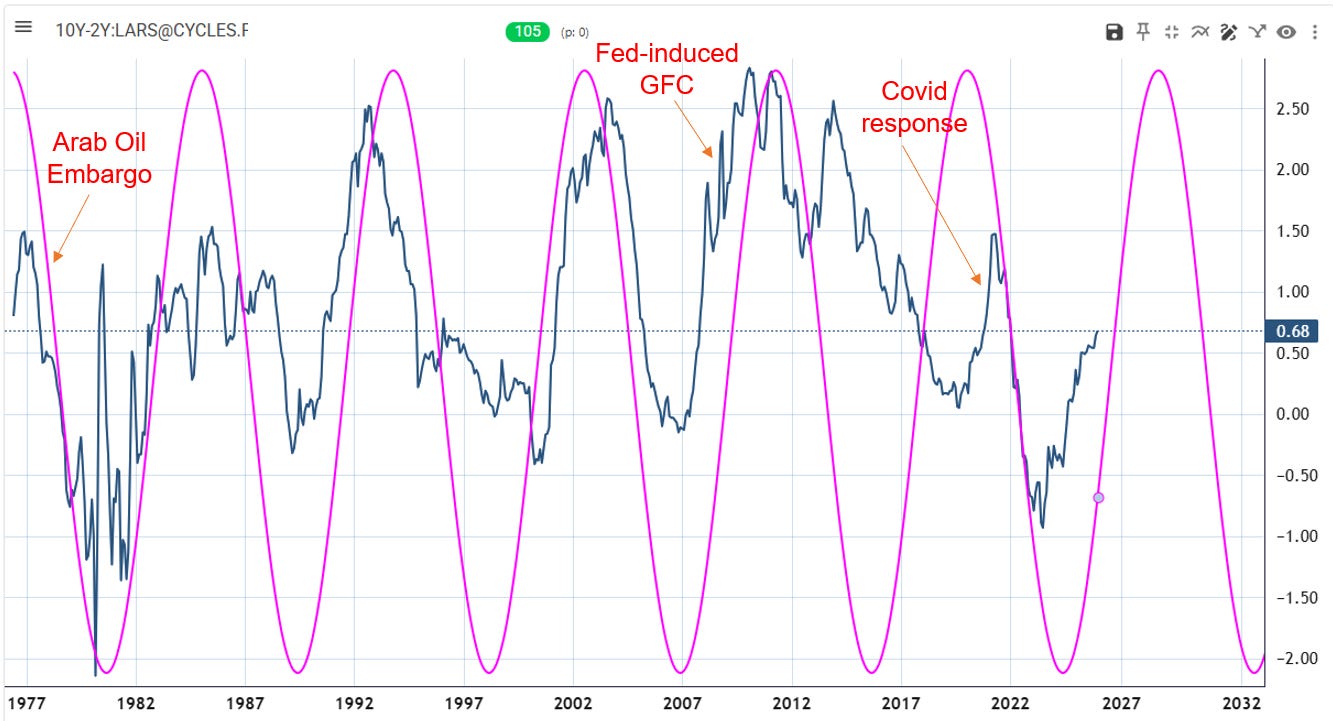
One of the most valuable segments of the conversation involved Lars von Thienen applying digital signal processing (DSP) techniques to the yield spread data using the Foundation for the Study of Cycles’ proprietary cycle analysis tools.
When the raw 10-year minus 2-year spread data was fed into the cycle scanner, the dominant detected cycle came in at 105 months — approximately 8.75 years. That is on the lower end of the known solar cycle range, but not quite at the expected average of roughly 11 years.
This is where McClellan’s domain expertise proved essential. He pointed out that the three exogenous events (oil embargo, 2008 crisis, COVID) had skewed the data. Von Thienen then created a corrected dataset — a virtual time series with those event-driven distortions smoothed out. When this adjusted data was re-analyzed, the dominant cycle shifted to 124 months, or 10.3 years — almost exactly the average length of recent solar cycles.
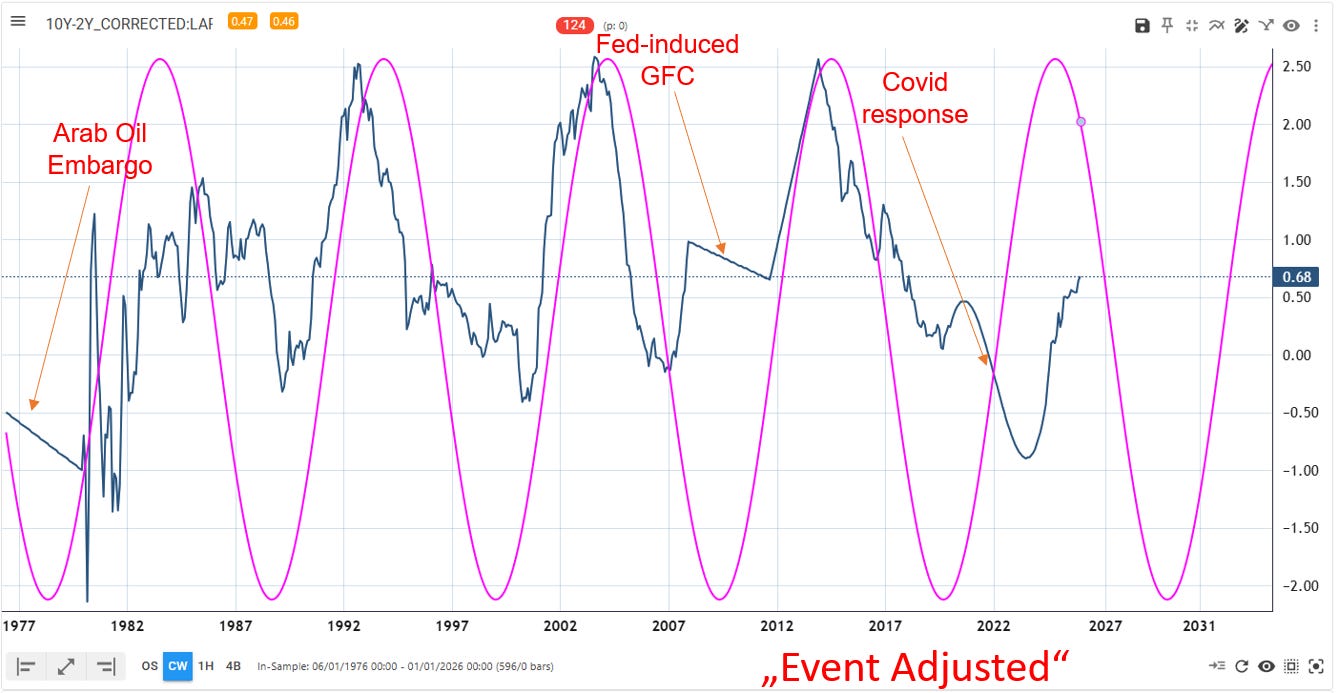
This exercise illustrates a fundamental principle of cycle analysis: static, purely mathematical approaches have limitations. Real-world cycles are dynamic. They stretch, compress, and occasionally get overwhelmed by singular events. The analyst who combines computational tools with contextual understanding of the data will always outperform the one who relies on algorithms alone.
As McClellan put it, you take the hypothesis, push it, challenge it, tweak it, and press it until it reveals its secrets. That iterative process — moving between data-driven detection and judgment-informed correction — is the hallmark of serious cycle research.
Hurricanes and the Inverted Solar Signal
The financial markets are not the only domain where sunspot cycles leave their fingerprint. McClellan also presented data on global tropical cyclone frequency, drawing on work by meteorologist Ryan Maue, who compiled a three-year running sum of worldwide hurricane activity.
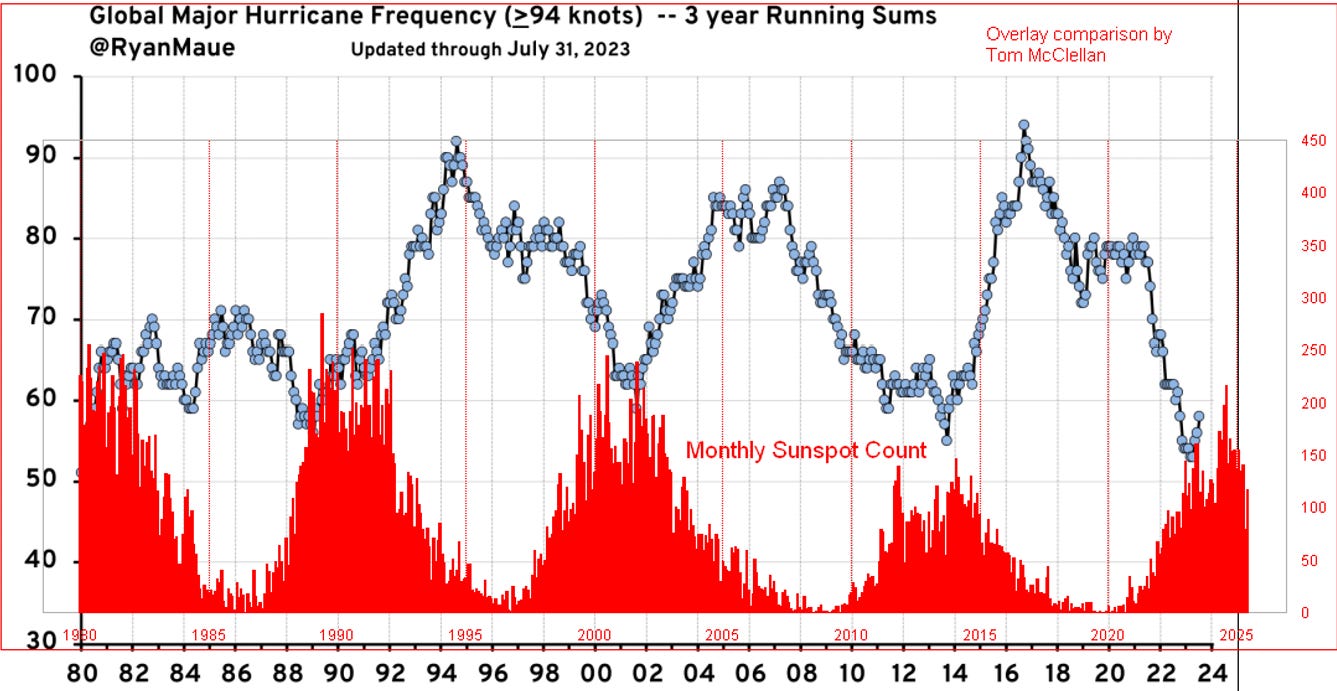
The relationship here is inverted: when sunspot counts are at their maximum, global hurricane frequency tends to be at its minimum. As sunspots decline, hurricane activity ramps up. The mechanism is not fully understood — it may involve how solar output modulates upper-atmosphere wind shear, sea surface temperatures, or other atmospheric dynamics — but the pattern in the data is clear.
Since we are now in a period of declining sunspot numbers heading toward the next solar minimum (expected around 2030), the implication is that global hurricane frequency should increase over the latter half of this decade. The quiet 2025 Atlantic season, with no hurricanes making U.S. landfall, may prove to be the calm before a more active period.
This is worth noting not as cause for alarm, but as context. Hurricane activity naturally oscillates on multi-year timescales, and understanding the solar connection helps place any single season — whether unusually quiet or unusually active — within a broader framework.
Social Unrest and the Ascending Phase
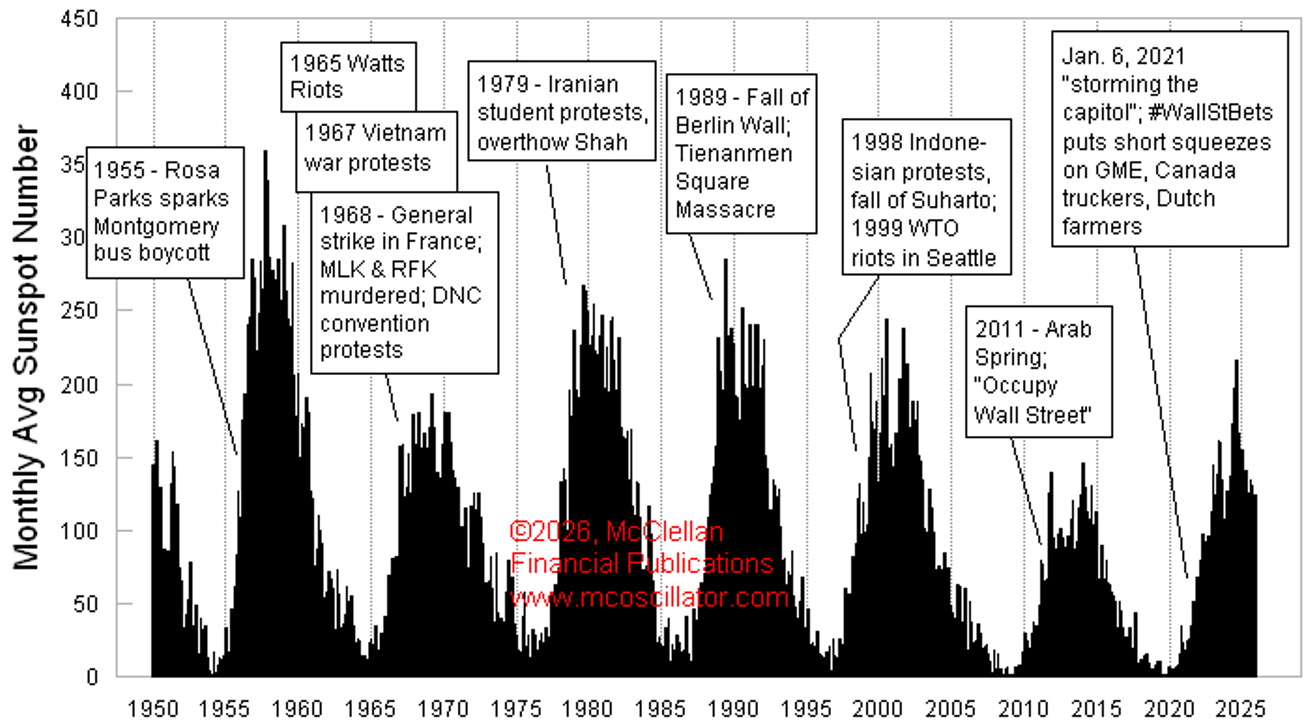
Perhaps the most provocative strand of McClellan’s research draws on work originally conducted over a century ago by Alexander Chizhevsky, a Russian scientist who studied the relationship between solar activity and episodes of social upheaval1.
Chizhevsky’s core finding was that the ascending phase of each sunspot cycle — the period when solar activity is ramping up toward its peak — tends to coincide with increased social unrest: revolutions, mass protests, political upheavals. The declining phase, conversely, tends to coincide with resolution and relative calm.
McClellan extended this analysis through the modern era, noting that the fall of the Berlin Wall, the Iranian Revolution of 1979, and the recent protest movements in Iran during 2022-2023 all occurred during ascending phases of their respective sunspot cycles.
There is a valid critique of this line of analysis: social unrest is not easily quantified, and if you look hard enough, you can find examples of upheaval at almost any point in history. McClellan acknowledged this limitation openly. The correlation is suggestive rather than definitive, and it relies more on narrative pattern-matching than on the kind of hard numerical analysis that characterizes the yield spread and unemployment work.
Still, the broader point has merit. If solar activity does influence human neurology in even subtle ways — and the physical mechanism is at least plausible, given the sun’s demonstrated ability to affect electromagnetic systems on Earth — then it would be surprising if that influence had no detectable effect on collective human behavior.
The current declining phase suggests a period of relative resolution rather than new eruptions of unrest. The next ascending phase, beginning in the early 2030s, would be the period to watch for the next wave of large-scale social movements.
What This Means for Investors in 2026 and Beyond
Drawing the threads together, here is the forward-looking picture that emerges from the sunspot framework:
The yield curve should continue steepening through approximately 2027, reflecting ongoing monetary easing and economic softness. The unemployment rate is expected to rise into mid-to-late 2027 before turning. This suggests that the recession many analysts have been debating may indeed materialize, or at the very least that economic growth will remain subdued for the next 12 to 18 months. Hurricane activity is likely to increase as we move deeper into the declining phase of the solar cycle, with implications for insurance markets, energy infrastructure, and coastal real estate. The current period favors resolution of social and geopolitical tensions rather than the eruption of new ones, though the early 2030s could see a reversal of that trend.
None of these projections should be treated as certainties. McClellan himself was emphatic on this point: cycles provide expectations, not guarantees. The analyst’s job does not end with generating a forecast — it continues with daily monitoring, validation, and willingness to adjust when the data diverge from the model.
The Case for Keeping an Open Mind
One of the recurring themes in the conversation was the resistance that this kind of cross-disciplinary analysis encounters. Astronomers study the sun. Economists study markets. The two communities rarely overlap, and each tends to view the other’s domain as irrelevant to their own. Climate scientists focus on atmospheric dynamics and resist the suggestion that their data might have financial applications. Market practitioners, in turn, dismiss anything that cannot be expressed in a Bloomberg terminal query.
McClellan has experienced this pushback firsthand and makes a pragmatic case for intellectual openness. We use gravity every day without fully understanding it. We flip light switches without knowing the physics of electron flow. Understanding why something works is fascinating and worth pursuing, but it is not a prerequisite for using the relationship. The human brain is, at a fundamental level, an electrochemical system — a bundle of wires, as McClellan put it. If a sufficiently powerful solar event like the 1859 Carrington Event can induce voltage surges on telegraph wires and fry electronics, it is not a large conceptual leap to consider that subtler variations in solar output might influence the electrical activity in the human nervous system, even if only at the margins.
The sunspot-to-yield-curve correlation, with its three-year lag, is not a magic formula. It broke down during the GFC. It broke down during COVID. But it has reasserted itself every time, and it is currently tracking well. For an investor, that represents useful information — one more input in the decision-making process, not a replacement for all other inputs, but a genuinely informative one.
It is also worth noting what this framework is not. It is not astrology. It is not planetary alignment mysticism. McClellan was explicit in distinguishing his solar-based research from the kind of horoscope-style market analysis that has long given technical analysis a bad name. His approach starts with data, tests for statistical relationships, applies time-shifting to optimize correlation, and then subjects the results to scrutiny — including the honest acknowledgment of where and why the model fails. That is the scientific method, applied to an unconventional dataset.
Looking Ahead - “Cycles in the City”
The Foundation for the Study of Cycles continues to explore these relationships through both traditional analysis and modern digital signal processing tools. The upcoming Cycles in the City conference in New York (late May 2026) will feature McClellan speaking on the physics of natural frequencies and their application to financial markets — a topic that bridges his background in aerospace engineering at West Point and his three decades of market analysis alongside his father, Sherman McClellan.

Register here: cycles.org/cycles-in-the-city/
For those interested in the intersection of natural science and market behavior, this is an area of research that rewards curiosity and punishes closed-mindedness. The sun has been cycling for billions of years. The data now stretches back nearly three centuries. The correlations are measurable, the framework is testable, and the implications are actionable.
As McClellan reminded us: you take the hypothesis, push it, challenge it, tweak it, and press it until it confesses all of its sins. That is how real discovery happens — not by clinging to a single model, but by iterating between expectation and confirmation, between the computational and the contextual, between what the data say and what the world actually does.
The only question is whether you are willing to look up.
All the best,
Lars von Thienen
Tom McClellan
The Foundation for the Study of Cycles conducts ongoing research into cyclical patterns across markets, natural systems, and human behavior. For more information, visit the Foundation’s website or subscribe to McClellan Financial Publications for regular market timing analysis.
About the authors
Tom McClellan is the editor of The McClellan Market Report and creator of the McClellan Oscillator, one of the most widely followed breadth indicators in technical analysis. His research spans market cycles, liquidity patterns, and intermarket relationships. Learn more at mcoscillator.com.
Lars von Thienen is a member of the Board of the Foundation for the Study of Cycles and creator of the cycle analysis platform. He hosts Cycles TV, a series dedicated to exploring the role of natural and market cycles in financial decision-making. Learn more at cycles.org.
Disclaimer
Information contained on this site is obtained from sources believed to be reliable, but its accuracy cannot be guaranteed. Lars von Thienen “lars.cycles.org” is a publisher of scientific cycle analysis results for global markets and is not an investment advisor. The published analysis is not designed to meet your personal circumstances – we are not financial advisors and do not give personalized financial advice. The opinions and statements contained herein are the sole opinion of the author and are subject to change without notice. It may become outdated and there is no obligation to update any such information.
Any projections, market outlooks or estimates herein are forward looking statements and are inherently unreliable. They are based upon certain assumptions and should not be construed to be indicative of the events that will occur.
Investments should be made only after consulting with your financial advisor and only after reviewing the prospectus or financial statements of the company or companies in question. You shouldn’t make any decision based solely on what you read here.
Neither the publisher, the author nor any of its affiliates accepts any liability whatsoever for any direct or consequential loss howsoever arising, directly or indirectly, from any use of the information contained herein.
Gorbanev, Mikhail (2025): “Extraordinary Economic and Social Events Associated with the Solar Cycle Maximum”,
Source: https://mpra.ub.uni-muenchen.de/123402/1/MPRA_paper_123402.pdf