
The next wave on the horizon for the US stock markets – it is time to prepare
Long- and short-term cycles are lining up – technical indicators start to confirm


Weekly Cycles
The weekly S&P 500 shows that the nominal 180-week cycle, currently at 177 weeks, is in an early topping stage. This long-awaited time cycle has been monitored since the end of 2023 and has been cited as a key driver for the upturn lasting into this window. Now that we have arrived at this point, we need to pay close attention to the shorter-term cycles and technical indicators.

Weekly S&P 500 with nominal 180 weeks / 41 month cycle topping | 23. Oct. 2024
Before moving to the daily cycle analysis, it is worth noting that the cyclic-tuned RSI indicator has reached the upper band, indicating a "bull exhaustion" mode. This condition can turn within days into a "bulls tired" and/or "bulls exit" state, signaling that we are primed for a longer-term reversal.
The same weekly cycles situation can be observed on the NASDAQ.
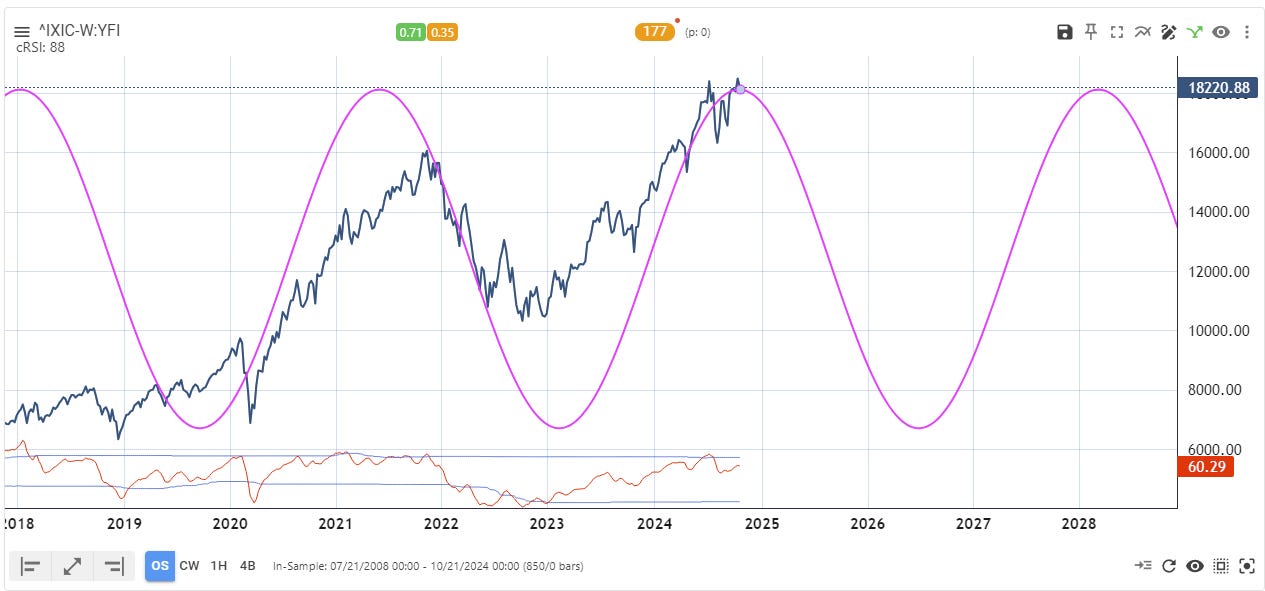
NASDAQ weekly cycles | 23. October 2024
The Nasdaq's weekly technical cRSI shows an even more intriguing divergence, with the indicator making a lower top. This suggests the bulls are losing their positive momentum.
Daily cycles
Let's now examine the daily cycles, starting with the S&P 500 model.
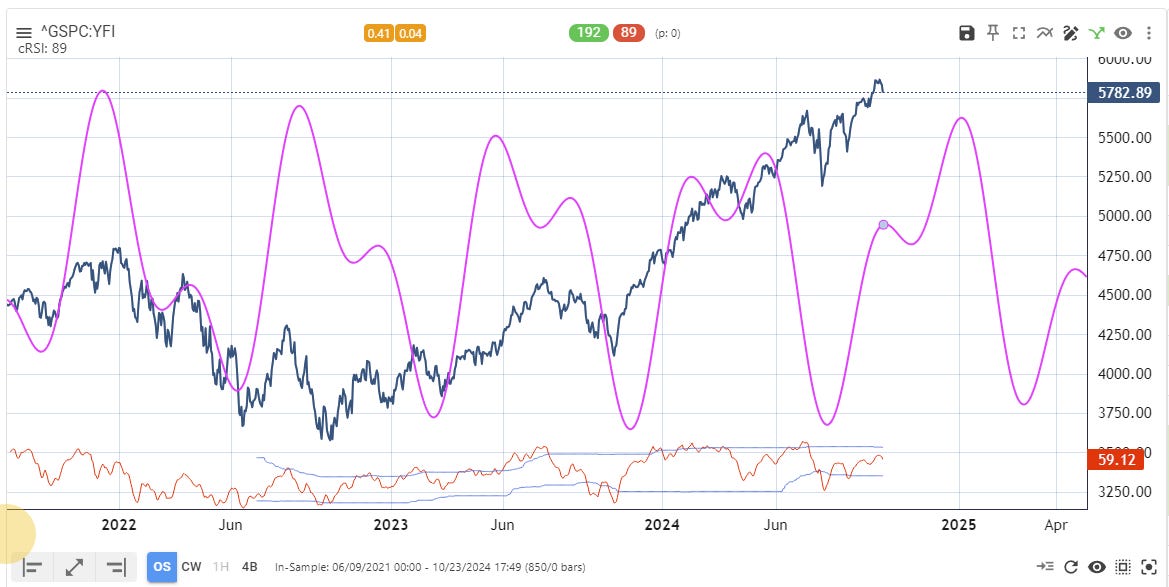
S&P 500 daily dominant cycles model | 23, Oct. 2024
The main cycles are the 192-day and the harmonic 89-day trading cycles. The daily composite model suggests a topping pattern either now or potentially by the end of the year. The cRSI indicator shows we are nearing the upper band, which could also signal a final year-end rally before both daily cycles align with the downward-trending weekly cycle noted earlier.
A similar perspective can be observed in the Nasdaq daily data.

Nasdaq Composite daily dominant cycles model | 23. Oct 2024
The shorter-term daily cycles with lengths of 80 and 200 trading days on the Nasdaq model are rolling over now and will likely continue into the end of 2024. These cycles are also coming into alignment with the next long-term downward swing, which is in sync with the long-term cycles shown earlier.
It's worth noting that we're seeing a divergence forming, as the market experienced a clear topping pattern in June of this year: At that time, the composite model peaked while the cRSI was breaking down below the upper band, issuing a sell signal. The price never went back to achieve a higher high, and the cRSI is indicating an even bigger divergence between the price action and the signal line.
Price and cyclic tuned indicator models
The technical indicators shown below have been adjusted to the cycles detected and mentioned above. The highlighted red or green shaded areas indicate that the higher timeframe - here the weekly - is also taken into consideration. Starting with the S&P 500 first.

S&P 500 - cRSI cyclic indicator | 23. Oct. 2024
The multi-timeframe cyclic technical indicator is showing a clear divergence between price and the signal. While the weekly chart confirms another overbought situation at the time the divergence signal emerges, this provides technical confirmation of a possible top in place.
A similar technical condition can be observed on the NASDAQ.
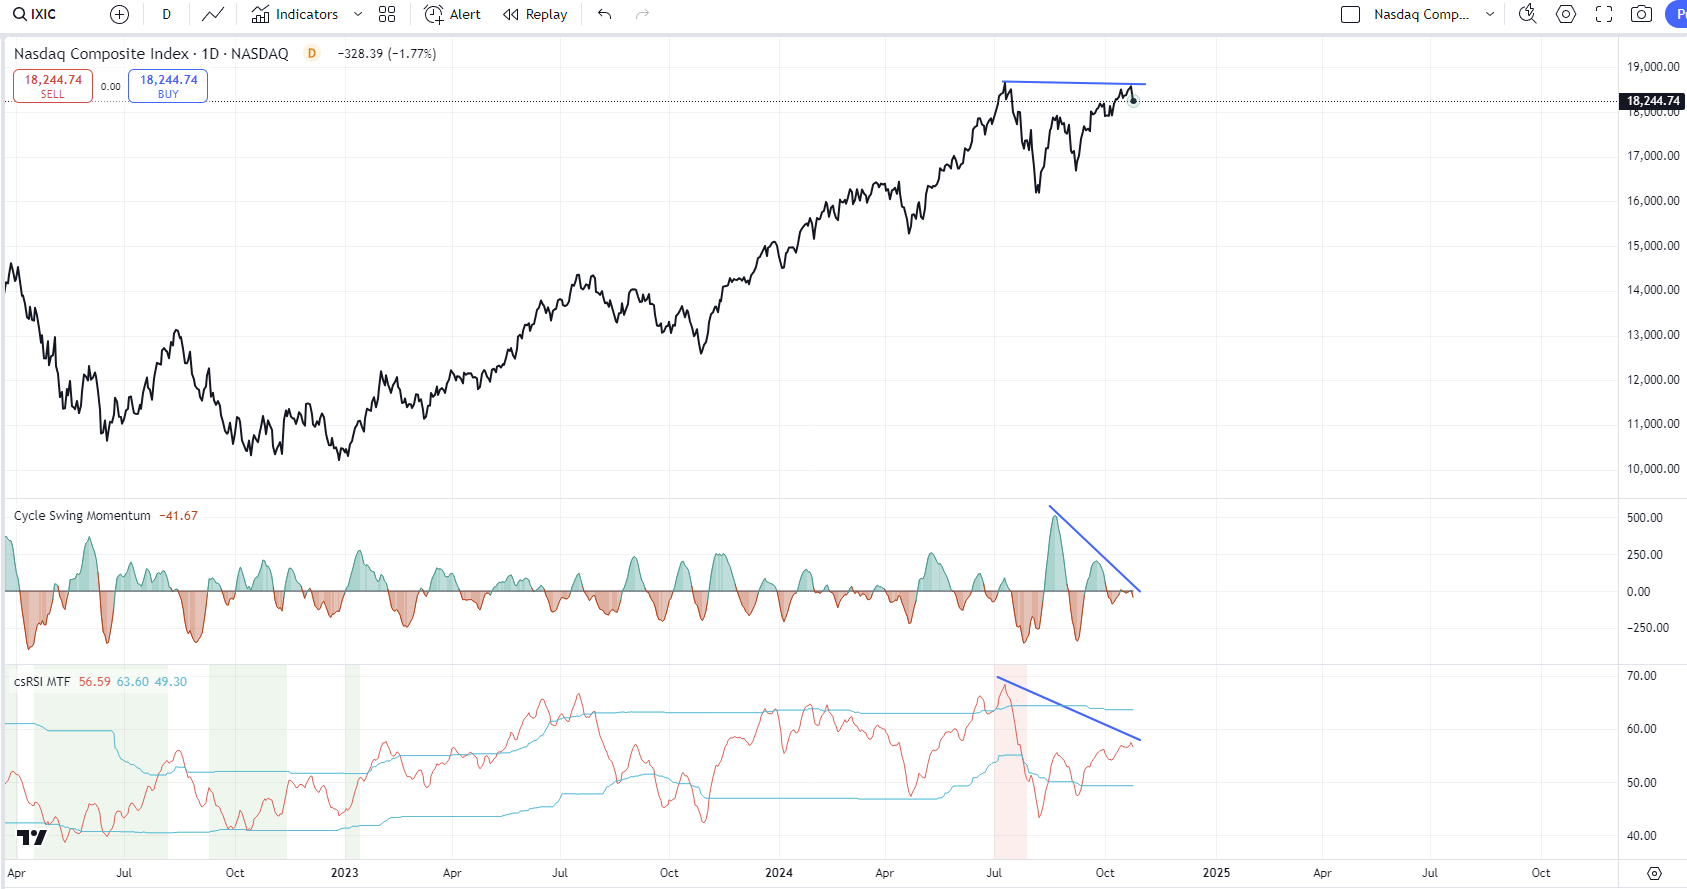
Nasdaq Composite – 23. Oct 2024
I have added another cyclic indicator, the cycle swing momentum. While momentum needs to be interpreted differently, the cyclic momentum has been continuously declining since the June top. And now, since the beginning of October, it has remained in negative territory. This also forms a divergence with the price action and continues to stay negative.
To provide a comprehensive perspective, I have included charts and clear data. For subscribers, I have added the cycle analysis screens shown above as an interactive workbook. This allows subscribers to explore the cycle details, the spectrum, and even experiment with different cycle configurations. If you are interested in this deep dive feature, feel free to join. Additionally, I will issue a podcast edition of this article, featuring voiceover comments for the subscribers, over the weekend.
Subscribers, please scroll down to the bottom to see all links to the interactive charts and workbooks.
Thanks & Regards,
Lars
© 2024 Lars von Thienen, All Rights Reserved.
Information contained on this site is obtained from sources believed to be reliable, but its accuracy cannot be guaranteed. Lars von Thienen “lars.cycles.org” is a publisher of scientific cycle analysis results for global markets and is not an investment advisor. The published analysis is not designed to meet your personal circumstances – we are not financial advisors and do not give personalized financial advice. The opinions and statements contained herein are the sole opinion of the author and are subject to change without notice. It may become outdated and there is no obligation to update any such information.
Any projections, market outlooks or estimates herein are forward looking statements and are inherently unreliable. They are based upon certain assumptions and should not be construed to be indicative of the events that will occur.
Investments should be made only after consulting with your financial advisor and only after reviewing the prospectus or financial statements of the company or companies in question. You shouldn’t make any decision based solely on what you read here.
Neither the publisher, the author nor any of its affiliates accepts any liability whatsoever for any direct or consequential loss howsoever arising, directly or indirectly, from any use of the information contained herein.
