Natural Gas - Cycles Analysis
It's time
The Russian war of aggression in Ukraine and the green energy turnaround have caused a major shake-up in the prices of fossil commodities such as gas, coal, and oil.
Cyclical movements are usually not rattled by these emotionally driven events. It is rather the other way around, cycles can predict the expectation for such events and reversals.
As natural gas is currently trading at historically low levels, it is time to see to what cycle analysis can show us in terms of gas prices.
Daily Cycle Analysis
We will use the natural gas futures contract for the daily analysis and use the period from 2016 to today for our dynamic time cycle analysis framework. The cycle spectrum shows a clear peak at a nominal cycle length of ~250 trading days (not calendar days).
Daily Spectrum Natural Gas Futures with clear peak at nominal ~255 trading days:

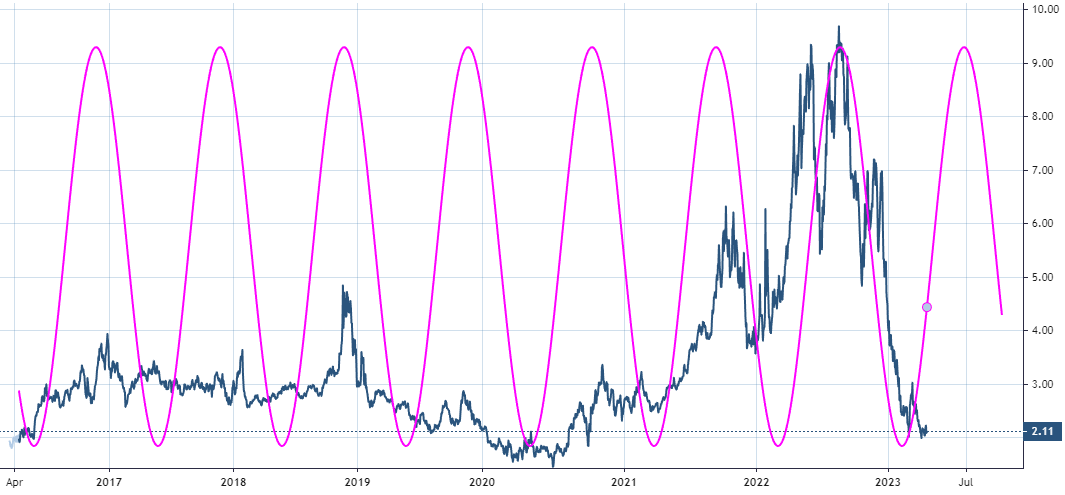
I we overlay the price chart with the current cycle phase and length of the detected 255 trading day cycle, we can see the alignment of previous tops and bottoms in the price of natural gas according to this time-cycle model.
Almost all tops and bottoms of the 255 days cycle relate to major changes in trend of the price for natural gas during the past 8 years. More important, the current cycle suggests an upswing now into summer this year.
Weekly Cycle Analysis
We also need to place a cycle analysis in the context of the next longer timeframe and the resulting dominant cycles. Therefore lets check what the weekly cycles tell us in addition to the daily.
We will go back to 2001 and use over 20 years of data for the weekly analysis to get a long term cyclic picture. The chart below reveals the dynamic time cycles for that period.
Indicating a clear peak at 141 weeks. We can select this cycle as most dominant time cycle.
Now, overlaying the 141 weeks cycle over the gas price chart to first check if there is a cyclic relation between the raw price and changes in trend based on this cycle.
This model suggest we are arriving at a long-term bottom currently and the next phase of this cycle is pointing upwards through the remainder of 2023 into 2025.
Summary
Weekly and daily cycles are indicating a cycles-within-cycles bottom alignment for natural gas. Pointing to higher prices ahead into summer (short-term) and into 2025 (long-term).
You know that I try to keep the bottom line and cycle charts free for all readers, while providing more insight to the analysis for the interested reader to learn and understand cycles. Therefore the main summary and key charts are free. In the following section I will provide further details for the one interested.
Thanks & Regards,
Lars
Cycle workbooks, audio commentary & my cyclic tuned multi-timeframe RSI indicator
We can use the detected cycle-length (255 daily / 141 weekly) to tune technical indicators on the price chart. You might now that I am using my cyclic-tuned RSI indicator to fine-tune price based patterns. I have added the technical chart based on these two cycles in the extended section below.
The shown charts above have also been saved as interactive cycle workbooks. These workbooks allow you to see the details of the cycle analysis with the included spectrum analysis, the selected cycle from that spectrum and the projection line. As they are interactive, you are able to check other parameters and cycles with this workbook on this dataset.
» The technical chart with cyclic-tuned RSI, audio commentary and interactive daily and weekly cycle workbooks are available at the bottom. ☟☟
© 2023 lars.cycles.org, Lars von Thienen, All Rights Reserved.
Any reproduction, copying, or distribution, in whole or in part, is prohibited without permission from the publisher.
Lars von Thienen “lars.cycles.org” is a publisher of scientific cycle analysis results for global markets and is not an investment advisor. The published analysis is not designed to meet your personal circumstances – we are not financial advisors and do not give personalized financial advice. The opinions and statements contained herein are the sole opinion of the author and are subject to change without notice.
Any projections, market outlooks or estimates herein are forward looking statements and are inherently unreliable. They are based upon certain assumptions and should not be construed to be indicative of the events that will occur. You shouldn’t make any decision based solely on what you read here.
Neither the publisher, the author nor any of its affiliates accepts any liability whatsoever for any direct or consequential loss howsoever arising, directly or indirectly, from any use of the information contained herein.


