
Decoding the Crypto Clock
A Deep Dive into Bitcoin’s Current Cycle Status

Are you tracking Bitcoin’s next major move? Forget the daily noise. To understand where BTC is really headed, we have to look beneath the surface at the powerful, repeating patterns that govern financial markets: the cycles of liquidity, halving, and price action.

Let’s break down where Bitcoin stands right now in October 2025, according to the latest data on cyclical movements.
The Lifeblood of Finance: Impact of Liquidity on Bitcoin
To truly understand Bitcoin’s journey, we must first understand Global Liquidity. This refers to the total availability of money worldwide that fuels economic activity and financial markets, including monetary policies from major economic players like the US, China, and Europe.
Here’s the critical link: As global liquidity increases, risk assets—and yes, that includes cryptocurrencies—tend to rise. When liquidity slows down, these assets often suffer.
Today, many institutional investors view Bitcoin as a reliable proxy, or barometer, for global liquidity conditions. In fact, Bitcoin price changes are 40% correlated to cycles in global liquidity, a statistic shared by Michael Howell of CrossBorderCapital in his publication Capital Wars . Importantly, changes in global liquidity tend to affect Bitcoin prices with a lead time of about three months.
Since the institutional entry around 2020, Bitcoin has evolved from an “alternative asset” into a cyclical “high risk-on asset”. This institutionalization has created common risk exposures, leading to a rising correlation with the S&P 500 (now 0.6+ correlation). Roughly 80% of crypto price variation now correlates with equity markets.
Long-Term Liquidity Cycle Status
When we look at the big picture, a massive 65-month cycle governs global liquidity.
According to cycle analysis, this long-term Global Liquidity Cycle is currently approaching its peak late 2025. The peak is specifically projected to occur around late 2025 to early 2026.

While the momentum of global liquidity is still positive, it is slowing down, largely influenced by the tightening policies of the US Federal Reserve. Once this 65-month cycle crests, global liquidity is expected to start declining.
Short-Term Price Cycle Status: The Bitcoin Dance
Short-term price moves are often framed by highly reliable cyclic patterns. A key pattern is the nominal 200 calendar days cycle (200cd cycle).
Short-Term Cycles & The 5-Count Up / 3-Count Down Pattern
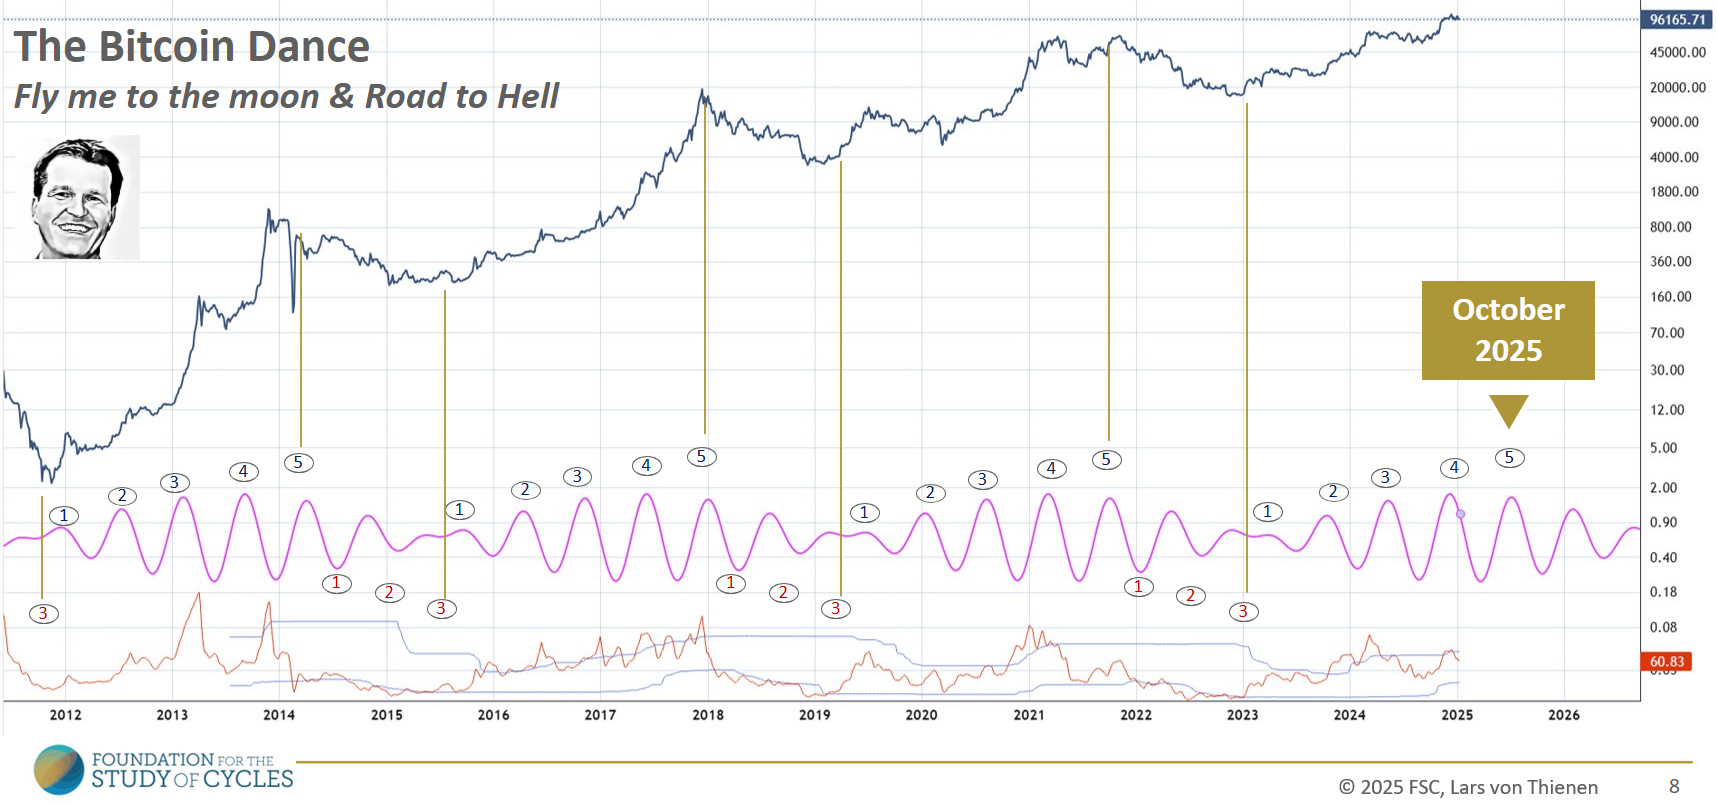
Historically, every major parabolic up-move has been preceded by the presence of a nominal 200 calendar days cycle. This cycle governs “The Bitcoin Dance”—the dramatic “Fly me to the moon” followed by the “Road to Hell”.
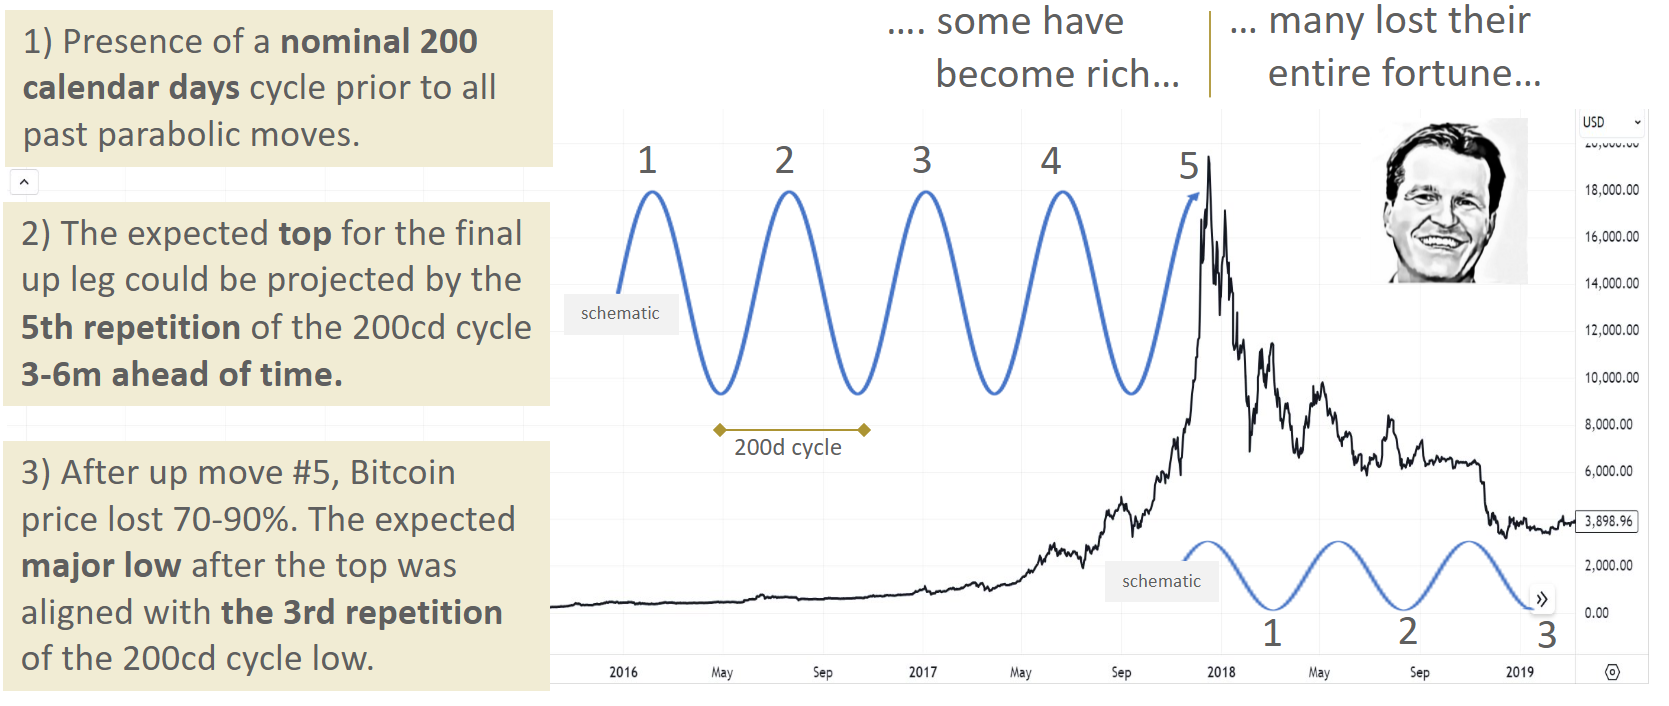
The anticipated top for the final up leg can be projected by the 5th repetition of the 200cd cycle. Following this top, Bitcoin price typically loses 70–90%. The expected major low after the top aligns with the 3rd repetition of the 200cd cycle low.
The schematic of this pattern looks like this:
• Up Move: 1 -> 2 -> 3 -> 4 -> 5 (Expected peak)
• Down Move: 1 -> 2 -> 3 (Expected major low)
In terms of specific cycle timing for October 2025:
A 202-day cycle is identified as peaking on October 28, 2025.
Current price cycle analysis for the Bitcoin Basket
Separately, a 200-day Bitcoin price basket cycle (based on 15 currency pairs) was identified as being at a top in October 2025.
The framework primarily draws on the work of Michael Howell (CrossBorderCapital) regarding Global Liquidity and analysis using multiple currency pairs to assess Bitcoin’s true value. The next cycle analysis uses a Bitcoin price basket cycle that is based on 15 currency pairs. This measures Bitcoin’s value not just against the USD, but against a basket of global currencies.
Think of it this way: BTC/USD cycle analysis is like checking your car’s speed on the dashboard. The GLI Bitcoin Basket cycle analysis is like checking the fuel gauge and the engine health. One tells you where you are right now, but the other tells you where you are likely to run out of steam or when you need a major overhaul.
The following chart is an analysis of the GLI BB data from CrossBorderCapital based on his Global Liquidity Bitcoin Basket.
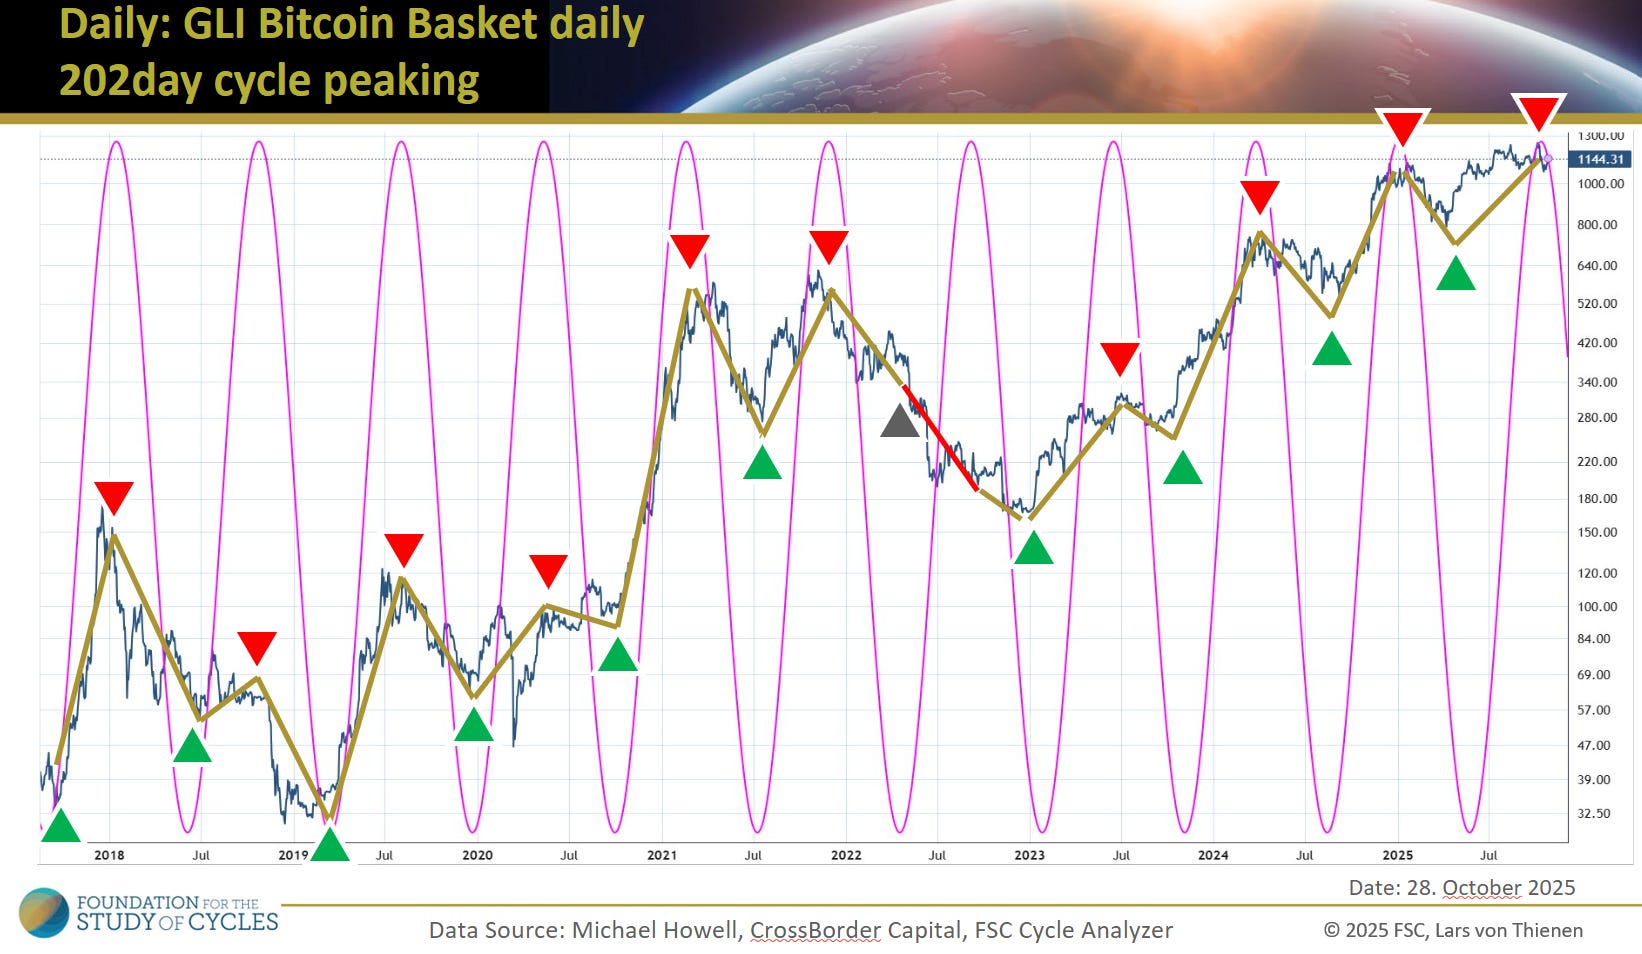
In zig-zag highlights, the time-based turning points on the GLI-BB are highlighted. As to be noted, there is only 1 leg out of 21 total cycle legs which has been out-of-sync with this cycle. Or the other way: that cycle was spot on with 95% accuracy to highlight the windows in time when the basket is expected to undergo a major regime shift.
Halving Cycle Status: The Excess Cycle
Bitcoin’s halving event—which occurs approximately every four years—historically drives significant price surges due to supply constraint. This gives rise to the “Halving Excess Cycle”.
Analysis of previous halving epochs (2012–2016, 2016–2020, 2020–2024) shows that performance is strongest after 400–500 days following the halving event.
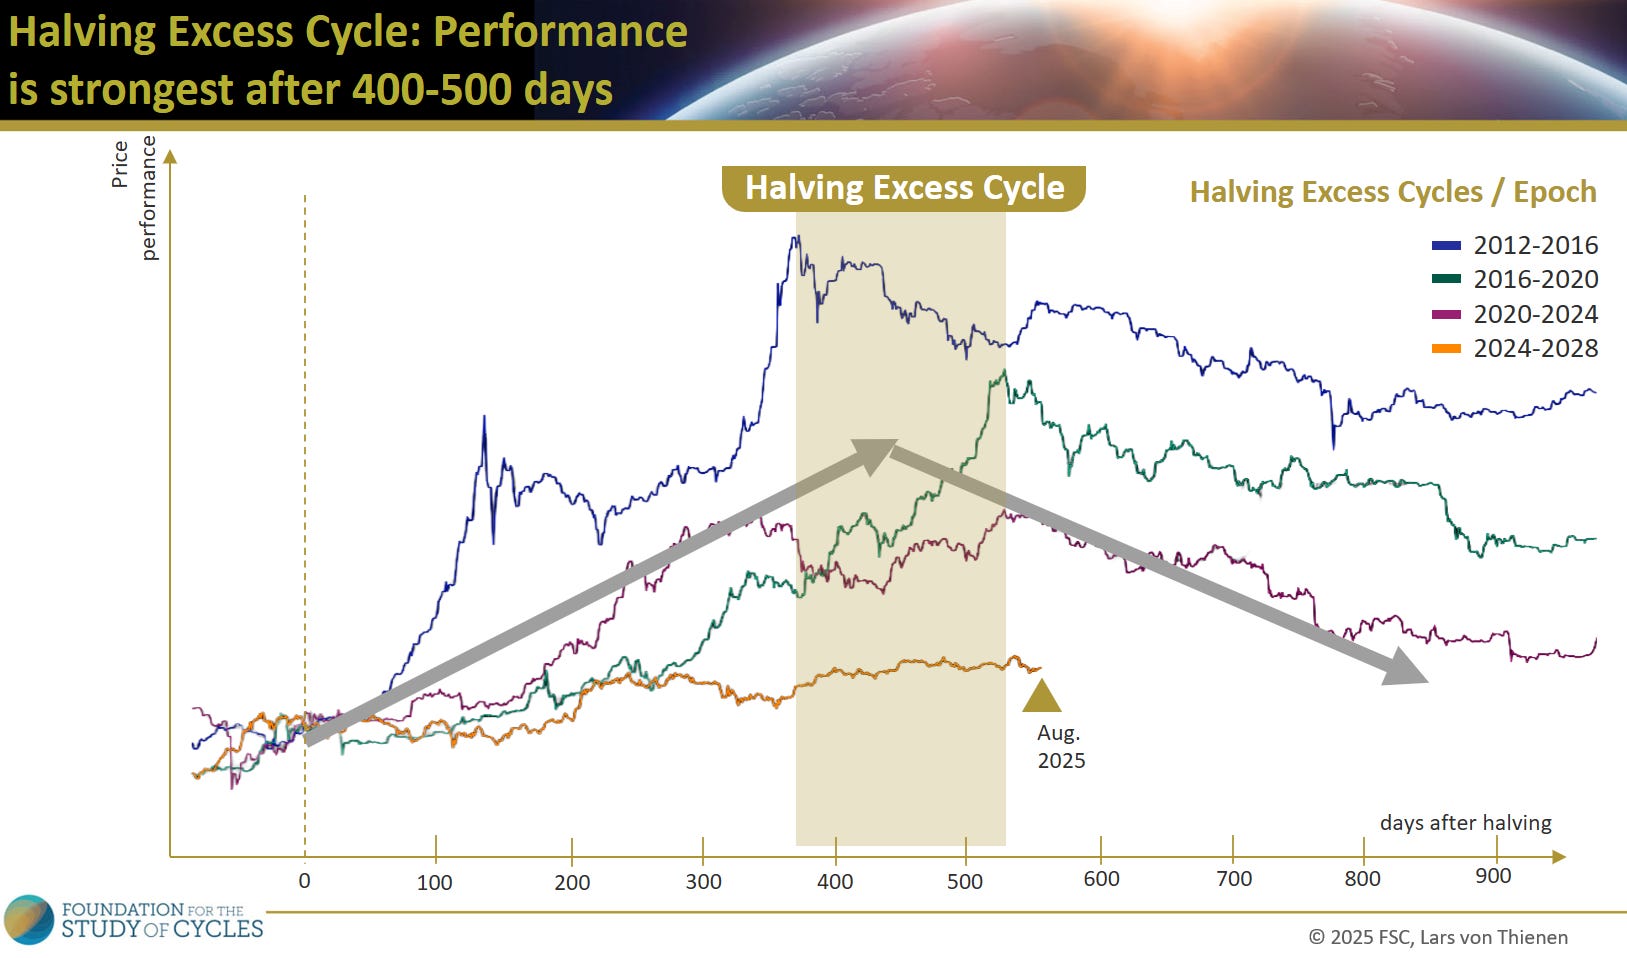
Halving Excess Cycle Schematic:
2024-2028 Epoch: Expected Peak: Aug. 2025 (400-500 days timeframe)
This suggests that Bitcoin is currently in a phase that points toward a downward trend until the next halving, scheduled for 2028.
Final Summary
The confluence of these major cycles points toward a significant inflection point for Bitcoin and risk assets as we approach 2026.
1. Long-Term Liquidity (65-month cycle) is nearing its peak in late 2025/early 2026.
2. BTC/USD Short-Term Price Cycles (200-day cycles) frame the final up leg of the current rally (the 5-count cycle dance) - topping in October.
3. GLI-Bitcoin Basket Short-Term Price Cycles frame the a top in October with 20 cycle legs out of 21 in sync with regime changes.
3. The Halving Excess Cycle suggests the primary bullish boost from the previous halving is already behind us.
Together, these cycles project a potential downturn in Bitcoin and other risk assets beginning in 2026. Based on cycle analysis, the second quarter of 2026 might mark significant market downturn.
Cycle analysis often goes against mainstream financial sentiment, especially when market hype is at its peak. But remember, history might not repeat exactly, but it surely does rhyme.
Keeping an eye on liquidity and these established cyclical patterns is crucial as we navigate the path toward 2026.
Full Video Interview
I was on the Paul Barron Podcast with an interview, if you interested in this discussion:
© 2025 Lars von Thienen, All Rights Reserved.
Information contained on this site is obtained from sources believed to be reliable, but its accuracy cannot be guaranteed. Lars von Thienen “lars.cycles.org” is a publisher of scientific cycle analysis results for global markets and is not an investment advisor. The published analysis is not designed to meet your personal circumstances – we are not financial advisors and do not give personalized financial advice. The opinions and statements contained herein are the sole opinion of the author and are subject to change without notice. It may become outdated and there is no obligation to update any such information.
Any projections, market outlooks or estimates herein are forward looking statements and are inherently unreliable. They are based upon certain assumptions and should not be construed to be indicative of the events that will occur.
Investments should be made only after consulting with your financial advisor and only after reviewing the prospectus or financial statements of the company or companies in question. You shouldn’t make any decision based solely on what you read here.
Neither the publisher, the author nor any of its affiliates accepts any liability whatsoever for any direct or consequential loss howsoever arising, directly or indirectly, from any use of the information contained herein.
Lars, your analysis of BTC is and has always been spot on correct. I keep recommending it friends and family. Keep up the great work.