
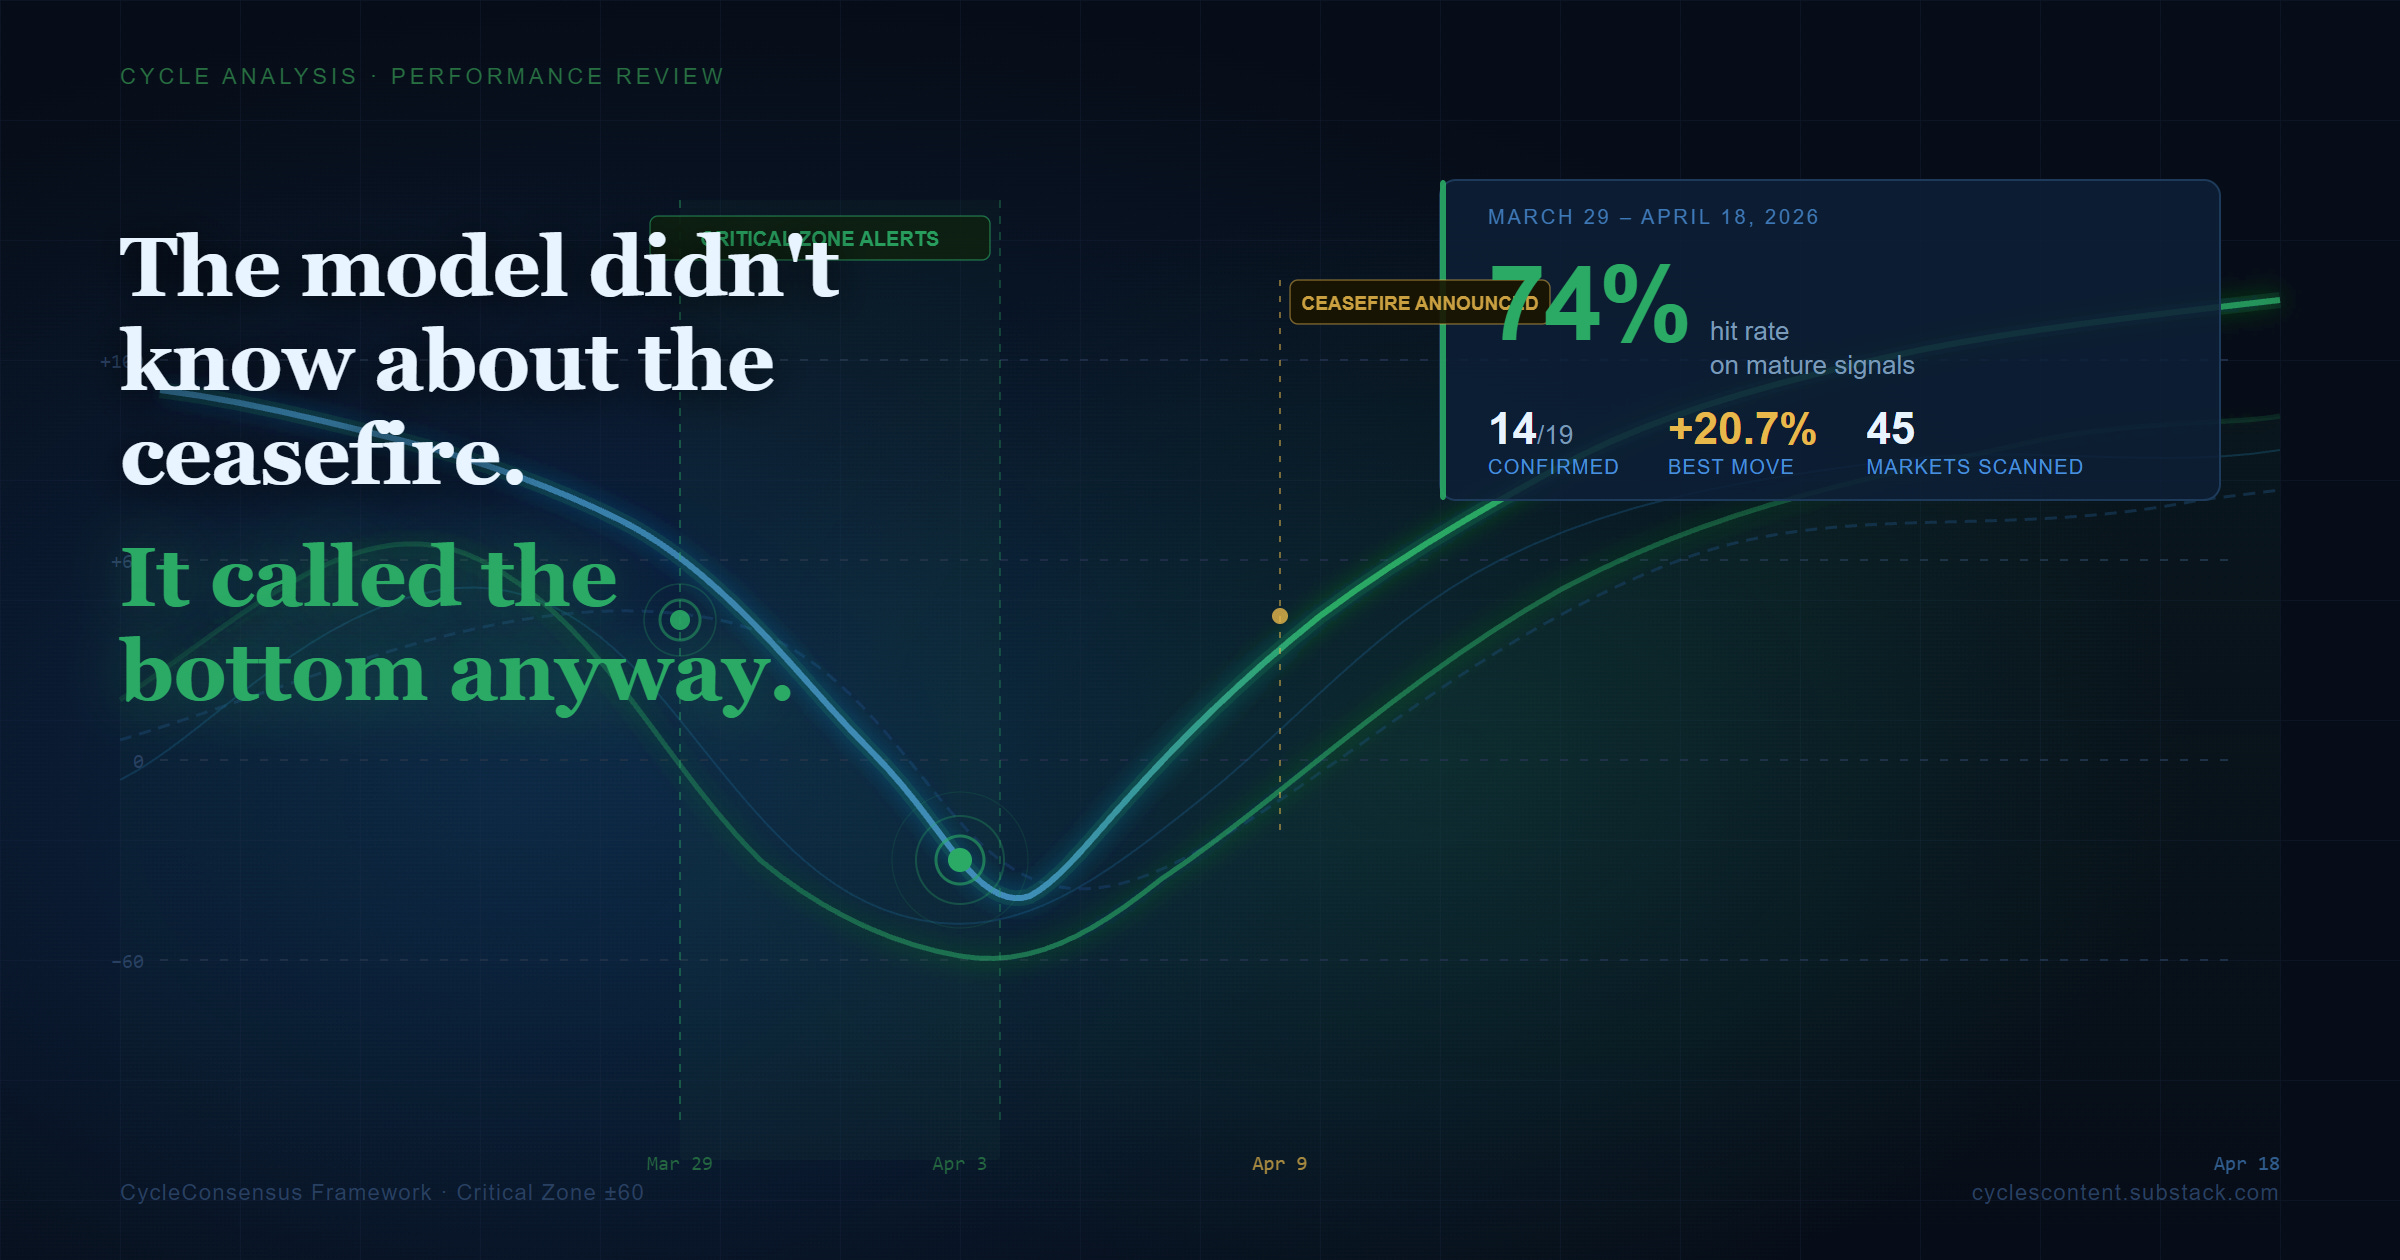
April 2026 Performance Review: 74% Hit Rate, Zero Narrative.
The Model Didn't Know About the Ceasefire. It Called the Bottom Anyway.

Cycles Checkback: how the critical-zone signals played out
Three weeks ago, our consensus model made its calls. This article checks the tape.
Think of it as a barometer reading taken before the storm: the “Cycle Consensus” framework reads cycle pressure across 45 global markets, not news headlines. When multiple independent cycles converge on the same turning point, the Cycle Consensus Score crosses ±60 — the critical zone, where conditions for a cyclical turn are statistically elevated. The model does not know about Iran ceasefires or earnings surprises. It reads cycles.
This review covers 19 mature alerts issued between March 29 and April 18. Each gets a verdict:
confirmed (price moved in the signaled direction within two to four weeks),
partially confirmed (the move started but reversed early or fell short of 3%),
not confirmed (price went the other way), or
too early to assess (signal too recent to judge).
No adjustments after the fact. What follows is the full record.
Summary
Fourteen of 19 mature signals confirmed within three weeks of the alert. Four partially confirmed. One did not.
The three-week window from late March to mid-April 2026 was a high-conviction period: the Iran war, the Hormuz closure, the ceasefire, and a 13% equity rally compressed what would normally be a multi-month cycle into three weeks of concentrated price action. The topping signal on Oil Futures (present before Brent reached its eventual $111 peak) and the cluster of equity bottoming signals issued March 29 through April 8, ahead of the ceasefire rally, are the clearest validations of the alerting function in this window.
The single most striking data point: the Wilshire 5000 registered a confirmed bear exit at a Cycle Consensus Score of +86 on April 3, three days before the Iran ceasefire was announced. The model detected broad-based bottoming conditions in the US equity market before the news catalyst reached the market. The S&P 500 gained 12.8% in the two weeks that followed. The one non-confirmation was S&P 500 Materials, the lowest-conviction signal in the archive: bear exhaustion, not exit, at the minimum old-scale rating. Exit signals confirmed at a materially higher rate than exhaustion signals across this window. The model identifies when conditions for a turn are statistically elevated. In this three-week period, it did that well.
Nine daily cycle analysis articles cover the window from March 29 to April 18, 2026. The period encompassed the escalation of the Iran-Israel conflict, the Strait of Hormuz closure, the ceasefire breakthrough on April 8, and the equity recovery that carried the S&P 500 from 6,315 to 7,126, a gain of more than 12% in under four weeks. The Cycle Consensus Score model flagged 115 critical-zone signals across those nine articles. Of those, 19 mature signals from articles published before April 13 have had sufficient time to confirm or deny. The 14 signals from April 16 and 18 are too early to assess; they remain open.

Confirmed signals

Signal-by-signal record
Oil Futures — topping alert, first issued March 29. The cycle model flagged Oil Futures as a topping candidate on March 29, on a bull exhaustion cRSI reading across seven contributing cycles (old scale). By April 2, the Cycle Consensus Score read -87 with bull exhaustion. The score upgraded to -87/-100 with bull exit across April 3, 8, and 10. Brent crude was near $111 per barrel at the time of the March 29 alert. On April 8 (the day Iran declared a ceasefire), Brent fell 13.5% in a single session to $94.45. By April 18, the price had declined a further -4.3% to approximately $90.40. Total decline from the alert-date price: approximately -18.6%. The cycle model alerted to conditions that preceded a major cyclical top. Price followed.
S&P 500 Energy — topping alert, first issued April 2 at score -93 (bull fatigue), April 3 at -100 (bull exit). With Oil Futures in a confirmed topping configuration, the S&P 500 Energy sector registered the model’s maximum score alongside a confirmed bull exit by April 3. The sector stood at 915.06 on April 6. By April 17, it had fallen to 842.98, a decline of -7.9%, moving in line with the crude sell-off. APA, COP, OXY, MPC, and VLO were all among the April 18 session’s laggards, confirming persistent sector underperformance.
US Dollar Index — topping alert, April 2–3 at score -93 (bull fatigue). The DXY reached a 10.5-month high on March 30, one day before the cycle model flagged it as a topping candidate. By April 17, the DXY had fallen to 97.70, a decline of -2.4% over the month. The move was directionally correct; the magnitude was modest. The directional precision of the alert at the exact multi-month high puts this squarely in the confirmed column.
German DAX — bottoming alert, first issued March 31, April 2 at score +93 (bear fatigue), April 8 at +100 (bear exit). The DAX was near 22,937 in early April when the model signaled maximum bottoming conviction with a bear exit on April 8. By April 16, the index had recovered to 24,154; by April 18 it held near 24,300, a gain of approximately +5.9% from the signal-date price. The alert arrived before the recovery, not after it.
Hang Seng Index — bottoming alert, first issued March 29, April 2–3 at score +100 (bear exit). Among the most persistently high-conviction signals in the archive. The Hang Seng appeared in the bottoming table across every article from March 29 through April 18, with a score of +100 and a confirmed bear exit by April 2. The index was near 24,200 at the range low and reached 26,394 by April 17, a gain of +9.1%.
BRICS iShares BIC 50 ETF — bottoming alert, first issued March 29, April 2 at score +89 (bear fatigue), April 3 at +95 (bear exit). The broad emerging markets ETF closed at 20.63 on March 30 — the nearest trading day to the alert date. By April 17, it had reached 21.73, a gain of +5.4%. The bear exit confirmation on April 3 arrived before the bulk of that move.
Nasdaq 100 — bottoming alert, first issued April 1 (old scale, bear fatigue), April 2 at score +82 (bear fatigue), April 8 at +95 (bear exit). QQQ closed near $606 on April 8 and reached an all-time high of $640.47 on April 16, a gain of +5.6% from that close. From the March 30 pivot, QQQ rose more than 8.5% by April 16. The bear exit upgrade at +95 on April 8 arrived on the same session as the Iran ceasefire announcement and the start of the sustained breakout.
Nasdaq Composite — bottoming alert, April 1 (old scale), April 2 at score +80 (bear fatigue), April 8 at +87 (bear exit). The Composite stood at 21,879 on April 2. By April 17, it had reached 24,468, a gain of +11.8%. The bear exit upgrade on April 8 preceded the final acceleration leg.
S&P 500 — bottoming alert, April 3 at score +67 (bear fatigue), April 8 at +75 (bear exit). The index stood near 6,315 on March 30. By April 18, it had reached 7,126, a gain of +12.8%. The bear exit upgrade on April 8 coincided with the Iran ceasefire session and the start of the final leg higher.
Wilshire 5000 — bottoming alert, April 3 at score +86 (bear exit), April 8 at +86 (bear exit). The Wilshire 5000 is the broadest measure of the US equity market, covering approximately 3,500 securities. The bear exit confirmation on April 3 arrived before the ceasefire: the model was detecting broad-based bottoming conditions before the news catalyst did. The index gained in excess of 12% over the two weeks that followed. The early timing is the key observation.
Euro FX Futures — bottoming alert, April 2–3 at score +100 (bear exit). The euro registered a maximum Cycle Consensus Score with a confirmed bear exit on April 2, the highest single-day bottoming conviction in the archive for the currency segment. EUR/USD strengthened from the low-$1.13 range to 1.1817 on April 16, a gain of approximately +4.4%.
Gold Futures — bottoming alert, April 2–3 at score +63 (bear exit). Gold was in the early $4,600s when the model flagged it as a bottoming candidate. By April 17, it had reached $4,867, a gain of approximately +5.8%. The metal added a further +1.30% on April 18, extending the move.
PHLX Semiconductor Index — bottoming alert, April 3 at score +66 (bear exit), April 8 at +66 (bear exit). The semiconductor index stood at 7,916 on April 6 — the nearest trading day to the alert date. By April 17, it had reached 9,556, a gain of +20.7%, the largest single-asset move in this review window. The bear exit confirmation on April 3 arrived before the primary leg higher; TSMC’s earnings beat on April 17 amplified the final push.
S&P 500 Financials — bottoming alert, March 29 (old scale, bear exhaustion), April 16 at score +61, April 18 at +62 (five converging cycles). The financials sector appeared in the bottoming table at both ends of the review window: once in the early archive on the old scale, and again in the two most recent articles on the new scale at five-cycle alignment, the highest cycle count in the bottoming table. The sector closed at 805.10 on March 30. By April 17, it had reached 872.34, a gain of +8.4%. On April 18, confirmation arrived at the individual stock level: ALLY, FITB, RF, STT, and TFC all reported strong Q1 earnings and rallied on the session.
Partially confirmed
Palladium Futures — bottoming alert, April 2 at score +93 (bear fatigue), April 8 at +85 (bear exit). Palladium’s path was not linear. After the model flagged a bottoming setup at +93 on April 2, the metal fell sharply, briefly touching below $1,400 on April 8 (the same day the Iran ceasefire was announced, which paradoxically brought broad commodity weakness). The sell-off proved short-lived. By April 15, Palladium had recovered to $1,584. The bottoming signal was valid directionally, but the deeper initial dip before the recovery keeps this at partial rather than full confirmation.
Nifty 50 — bottoming alert, March 29 (old scale, bear fatigue, rating -8), through April 18. The Nifty 50 appeared in the bottoming table across the full three-week window with consistent high scores, reaching a bear exit upgrade on April 10 at +95. India’s index participated in the broader EM recovery through early April. By April 16, however, India was down approximately 0.25% on a session where global markets gained 0.10–0.20%, and relative underperformance continued on April 18. The cyclical bottom appears to have occurred as the model flagged, but relative strength has been limited since. Partially confirmed on an absolute basis, with caveats on relative performance.
Gold Mining Junior ETF — bottoming alert, April 2–3 at score +85 (bear exit), April 8 at +66 (neutral). Gold rose nearly 6% from the April 2 signal date. Mining juniors tend to outperform the underlying metal during gold uptrends, consistent with directional confirmation for this ETF. Specific price data for the ETF is not available in the reviewed sources; partial rather than full confirmation is the appropriate classification.
Soybean Futures — topping alert, first issued March 31 (old scale, bull fatigue), April 2 at score -66, April 3 at -80, April 8 at -80. Soybeans registered a persistent topping alert across five separate articles over three weeks. Despite that duration and the high score, no soybean price data from the reviewed period confirms a directional move. No counter-evidence exists either. Partial confirmation pending price data is the appropriate classification.
Not confirmed
S&P 500 Materials — bottoming alert, March 29 and 31 (old scale, bear exhaustion, rating -7). Materials appeared as a bottoming candidate in the two earliest articles, using the old scoring scale, at the minimum qualifying rating with a bear exhaustion cRSI — the weakest signal type in the hierarchy. As of April 18, chemicals were explicitly among the session’s underperformers: ALB, CF, DOW, and LYB all lagged on a day the broader market gained 1.2%. The sector has not recovered in line with the broader market. The Materials bottoming signals from March 29–31 did not confirm.
Too early to assess
Seven signals issued between April 16 and April 18 have not had sufficient time to confirm or deny.
Full Review Table

If you made it this far — thank you!
This kind of review only matters if you were there for the signals when they came in. That’s what the daily newsletter is for: each morning, a fresh scan across 45 global markets, and an alert the moment the Cycle Consensus Score crosses into the critical zone. No commentary to fill space. No narrative stitched together after the fact. Just the model, and what it’s reading right now.
The next signal window is already building. If you want to be inside it when it prints — not reading about it three weeks later — subscribe below. It’s free to start.
All the best, yours,
Lars von Thienen
© 2026 Lars von Thienen, All Rights Reserved.
Information contained on this site is obtained from sources believed to be reliable, but its accuracy cannot be guaranteed. Lars von Thienen (”lars.cycles.org”) is a publisher of scientific cycle analysis results for global markets and is not a registered investment advisor. The published analysis is not designed to meet your personal circumstances. We are not financial advisors and do not give personalized financial advice. The opinions and statements contained herein are the sole opinion of the author and are subject to change without notice. They may become outdated and there is no obligation to update any such information.
Any projections, market outlooks, or estimates herein are forward-looking statements and are inherently unreliable. They are based upon certain assumptions and should not be construed to be indicative of the events that will occur. Past performance is not indicative of future results.
Investments should be made only after consulting with your financial advisor and only after reviewing the prospectus or financial statements of the company or companies in question. You should not make any decision based solely on what you read here.
Neither the publisher, the author, nor any of its affiliates accepts any liability whatsoever for any direct or consequential loss howsoever arising, directly or indirectly, from any use of the information contained herein.
Lars, your articles are great but having read the subscription page, I think it is reasonable for subscribers to expect more than just reports issued on your publishing schedule. You refer to interactive cycle workbooks and additional technical charts with cyclic-tuned indicators, which suggests subscribers should have some practical way to work with this material between reports.
Can you clarify exactly what access premium subscribers are supposed to receive in relation to those tools and indicators, whether through TradingView, the Cycles app, or otherwise, and when that access will be available?