
20y US Treasury Yields - A cyclical top?
Will the Yields turn?

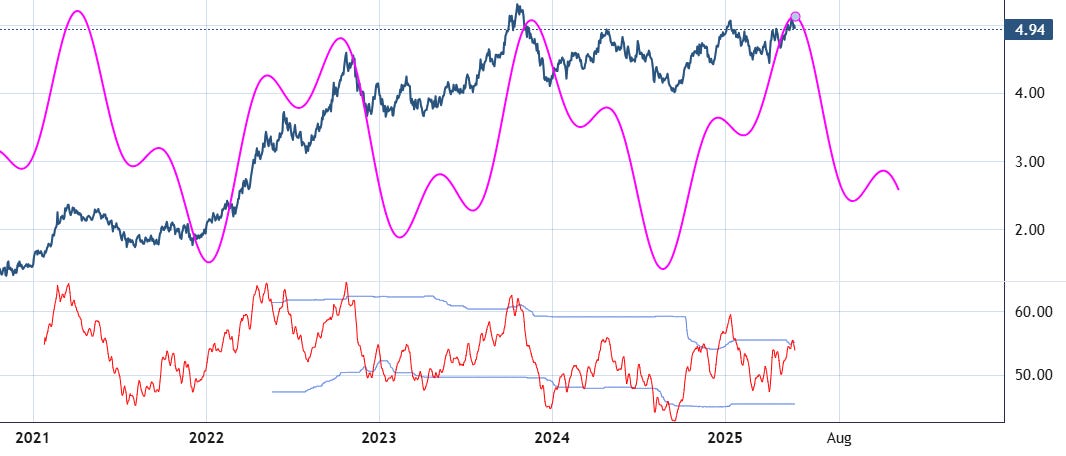
Composite Cycle Overlay & Price Series
Cycle Alignment: The fuchsia composite cycle has historically shown strong alignment with major turning points in the yield curve. Reviewing the past key dates, cycle tops and bottoms have closely preceded or coincided with significant trend changes in yields, confirming the composite cycle’s effectiveness as a timing tool.
Current Situation (Today – small dot): The price sits at 4.94, near the recent high. The composite cycle is at or very near a cyclical top, with the next turn indicated as a downturn (cycle top on 5/28/2025; next cycle bottom expected 8/21/2024 per the table, but visually the next meaningful trough is several months ahead).
Near-Term Outlook: From today until the next cycle turn, the composite cycle suggests a downward move in yields. This signals a likely forthcoming decrease in 20-year Treasury yields over the next few months.
cRSI Indicator Analysis (as visible on chart)
Current Status (5/29/2025): The cRSI is at 53.87, just below the upper band (55.14), and in a neutral position (no overbought/oversold signal).
Recent Signals: The last overbought reading was on 5/23/2025. The last actionable signal (sell) occurred on 1/27/2025 after a cross from above to below the upper band. No recent buy signals have been recorded.
Divergence: There is a bearish divergence: price made a higher low (4.92 → 4.94), but cRSI made a lower low (54.25 → 53.87). This indicates weakening momentum and supports a bearish outlook.
Composite Cycle & cRSI Alignment
Correlation at Key Points: Historically, when both the composite cycle and cRSI aligned (cycle top and cRSI overbought/sell signal), strong turning points followed (e.g., 10/12/2022, 4/25/2024).
Current Alignment: Both the composite cycle and the cRSI context are indicating the risk of an imminent reversal from the top. The composite cycle is at a peak, and cRSI recently flagged overbought and shows bearish divergence—this dual confirmation strengthens the bearish case for yields.
Profitability Analysis
Swing Trading (Cycle Turns): The strategy of trading at composite cycle turns has yielded a growth factor of ≈5.88× (+488%) since 12/2020, with a 65% win rate over 17 trades.
Long-Only Strategy: A buy-and-hold approach delivered ≈3.37× (+237%) over the same period.
Outperformance: The composite cycle swing strategy outperformed long-only by 74%, confirming the value of cycle-based timing.
Summary & Recommendation
Current Situation: The 20-year US Treasury yield is at a cycle top with both the composite cycle and cRSI indicating a likely upcoming decline.
Outlook (until next cycle turn): Expect yields to begin trending lower from current levels over the coming months.
Actionable Insight: For active traders, this is a high-probability zone to reduce long yield exposure or consider short positions in yields, based on the combined bearish signals from both cycle and cRSI.
Risk Note: Wait for confirmation if required by your strategy, but the alignment of both tools at this juncture has historically produced significant moves.
Cycle analysis interactive workbook URL for interactive chart analysis is included for supporting subscribers at the bottom.
© 2025 Lars von Thienen, All Rights Reserved.
Information contained on this site is obtained from sources believed to be reliable, but its accuracy cannot be guaranteed. Lars von Thienen “lars.cycles.org” is a publisher of scientific cycle analysis results for global markets and is not an investment advisor. The published analysis is not designed to meet your personal circumstances – we are not financial advisors and do not give personalized financial advice. The opinions and statements contained herein are the sole opinion of the author and are subject to change without notice. It may become outdated and there is no obligation to update any such information.
Any projections, market outlooks or estimates herein are forward looking statements and are inherently unreliable. They are based upon certain assumptions and should not be construed to be indicative of the events that will occur.
Investments should be made only after consulting with your financial advisor and only after reviewing the prospectus or financial statements of the company or companies in question. You shouldn’t make any decision based solely on what you read here.
Neither the publisher, the author nor any of its affiliates accepts any liability whatsoever for any direct or consequential loss howsoever arising, directly or indirectly, from any use of the information contained herein.
